Page 243 - ePaper
P. 243
Chapter 4: Restoring Convergence between Member States in the EU and EMU
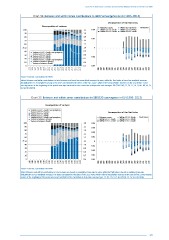
Chart 36: Between and within zones contributions to AROP convergence in EU (1995–2013)
Decomposition of the Theil index
Decomposition of variance Between zones Within EU-15 North Theil index
100 1.5 0.04 Within EU-15 South Within EU-13 North
Within EU-15 Centre
Within EU-13 South
90 1.4
80 1.3 0.02
70 1.2
60 1.1
50 1.0 0
%
40 Variance EU-15 South and periphery 0.9
30 Variance EU-15 Centre 0.8 -0.02
Variance EU-15 North
20 Variance EU-13 North 0.7
Variance EU-13 South and periphery
10 Variance between (share) 0.6
Variance between (level)
0 0.5 -0.04
1995 1996 1997 1998 1999 2000 2001 2002 2003 2004 2005 2006 2007 2008 2009 2010 2011 2012 2013 1995 1996 1997 1998 1999 2000 2001 2002 2003 2004 2005 2006 2007 2008 2009 2010 2011 2012 2013
Source: Eurostat, calculations DG EMPL.
Notes: Between and within contributions to total variance are based on unweighted averages by zone, while the Theil index is based on weighted averages
(including the EU-28 weighted average). The dates correspond to the dates of the SILC waves which refer to households’ incomes on the year before. Some
missing values at the beginning of the period were kept constant for the calculation of dispersion and averages: RO (2005-06), CZ, DE, CY, LV, LT, HU, MT, NL, PL,
SI, SK, UK (2004).
Chart 37: Between and within zones contributions to S80/S20 convergence in EU (1995–2013)
Decomposition of variance
Variance EU-15 South and periphery
Variance EU-15 Centre Decomposition of the Theil index
Variance EU-15 North
Variance EU-13 North
Variance EU-13 South and periphery Between zones Within EU-15 North Theil index
Variance between (share) Within EU-15 South Within EU-13 North
Within EU-13 South
Variance between (level)
Within EU-15 Centre
100 1.6 0.04
90 1.5 0.03
80 1.4
70 1.3 0.02
60 1.2 0.01
% 50 1.1 0
40 1.0 -0.01
30 0.9
20 0.8 -0.02
10 0.7 -0.03
0 0.6 -0.04
1995 1996 1997 1998 1999 2000 2001 2002 2003 2004 2005 2006 2007 2008 2009 2010 2011 2012 2013 1995 1996 1997 1998 1999 2000 2001 2002 2003 2004 2005 2006 2007 2008 2009 2010 2011 2012 2013
Source: Eurostat, calculations DG EMPL.
Notes: Between and within contributions to total variance are based on unweighted averages by zone, while the Theil index is based on weighted averages
(including the EU-28 weighted average). The dates correspond to the dates of the SILC waves which refer to households’ incomes on the year before. Some missing
values at the beginning of the period were kept constant for the calculation of dispersion and averages: CZ, DE, CY, LV, LT, HU, MT, NL, PL, SI, SK, UK (2004).
241