Page 239 - ePaper
P. 239
Chapter 4: Restoring Convergence between Member States in the EU and EMU
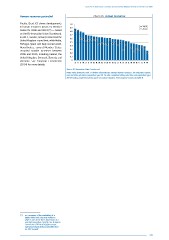
Human resource potential Chart X3: Human resources
Finally, Chart X3 shows developments 1.0
in human resources across EU Member 0.9 2006
91
States for 2006 and 2013 ( ) — based 0.8 2013
on the EU-Innovation Union Scoreboard. 0.7
In 2013, Sweden, Finland, Ireland and the 0.6
United Kingdom scored best, while Malta, 0.5
Portugal, Spain and Italy scored worst. 0.4
Nevertheless, several Member States
recorded notable increases between 0.3
2006 and 2013, including Ireland, the 0.2
United Kingdom, Denmark, Slovenia and 0.1
Romania. See European Commission 0 SE FI IE UK SI LT FR BE NL DK DE CY SK AT EU EE CZ PL LV LU EL HU RO BG IT ES PT MT
(2014) for more details.
Source: EU-Innovation Union Scoreboard.
Notes: Value between 0 and 1. A higher value indicates stronger human resources. The indicators capture:
new doctorate graduates, population aged 30–34 with completed tertiary education and population aged
20–24 having completed at least upper secondary education. See European Commission (2014).
91
( ) i.e. a measure of the availability of a
highly skilled and educated workforce
which is one of the three dimensions of a
country’s innovation capacity. See European
Commission (2014) at http://ec.europa.
eu/enterprise/policies/innovation/files/ius/
ius-2014_en.pdf.
237