Page 240 - ePaper
P. 240
Employment and Social Developments in Europe 2014
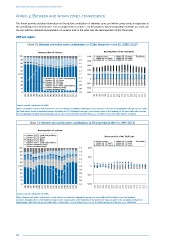
Annex 3: Between and within zones convergence
This Annex provides detailed information on the relative contribution of between zones and within zones trends in dispersion to
the overall dispersion trend in the EU as a complement to section 1. For this purpose, two decomposition methods are used, one
the one side the standard decomposition of variance and on the other side the decomposition of the Theil index.
GDP per capita
Chart 30: Between and within zones contributions to GDPpc dispersion in the EU (1995–2013)
Decomposition of variance Decomposition of the Theil index
100 1.7 0.10 Between zones Within EU-15 North Theil index
90 1.6 0.08 Within EU-15 South Within EU-13 North
Within EU-15 Centre
Within EU-13 South
80 1.5
70 1.4 0.06
60 1.3 0.04
50 1.2 0.02
%
40 Variance EU-15 South and periphery 1.1 0
30 Variance EU-15 Centre 1.0
Variance EU-15 North
20 Variance EU-13 North 0.9 -0.02
Variance EU-13 South and periphery
10 Variance between (share) 0.8 -0.04
Variance between (level)
0 -0.06
1995 1996 1997 1998 1999 2000 2001 2002 2003 2004 2005 2006 2007 2008 2009 2010 2011 2012 2013 0.7 1995 1996 1997 1998 1999 2000 2001 2002 2003 2004 2005 2006 2007 2008 2009 2010 2011 2012 2013
Source: Eurostat, calculations DG EMPL.
Notes: Calculations based on GDP in real terms, in euros. Between and within contributions to total variance are based on uneweighted averages by zone, while
the Theil index is based on weighted averages (including the EU-28 weighted average). Some missing values in the beginning of the period were kept constant
for the calculation of dispersion and averages: BG, EE, HR, CY, MT (1995-99), LV (1995-98), EL, LT, SK (1995-97), PL, RO (1995-96), HU, SI (1995).
Chart 31: Between and within zones contributions to ER dispersion in the EU (1995–2013)
Decomposition of variance
Variance EU-15 South and periphery Decomposition of the Theil index
Variance EU-15 Centre
Variance EU-15 North
Variance EU-13 North Between zones Within EU-15 North Theil index
Variance EU-13 South and periphery Within EU-15 South Within EU-13 North
Variance between (share) Within EU-15 Centre Within EU-13 South
100 Variance between (level) 1.5 0.04
90 1.4
80 1.3 0.02
70 1.2
60 1.1
% 50 1.0 0
40 0.9
30 0.8 -0.02
20 0.7
10 0.6
0 0.5 -0.04
1995 1996 1997 1998 1999 2000 2001 2002 2003 2004 2005 2006 2007 2008 2009 2010 2011 2012 2013 1995 1996 1997 1998 1999 2000 2001 2002 2003 2004 2005 2006 2007 2008 2009 2010 2011 2012 2013
Source: Eurostat, calculations DG EMPL.
Notes: Between and within contributions to total variance are based on unweighted averages by zone, while the Theil index is based on weighted
averages (including the EU-28 weighted average). Some missing values in the beginning of the period were kept constant for the calculation of dispersion
and averages: HR (1995-01), BG, MT (1995-99), CY (1995-98), LT, LV, SK (1995-97), CZ, EE, PL, RO (1995-96), HU, SI (1995), AT, FI, SE (1990-94).
238