Page 237 - ePaper
P. 237
Chapter 4: Restoring Convergence between Member States in the EU and EMU
Inserting equation (A.8) into (A.7) and adding a term MU to capture a price mark-up, yields an equation that can be estimated as
log(Pt/Pt-1)= a log( Pt-1/Pt-2)+ b log(NULCt/NULCt-1) + e log[(PXt/PROD_Xt)/ [(PXt-1/PROD_Xt-1)]
+ f log(PMCt-1 / Pt-1) + g MUt + constant (A.9)
with
a= (1-x+x z1 – x y z1)
b= x y g1
e= x y g2
f= x (1-y) z2
Towards empirical application
The empirical analysis is based on harmonised, seasonally-adjusted and working-time adjusted, quarterly Eurostat data. The
89
business cycle effect is measured by fluctuations in national gross domestic product ( ). Prices as well as gross value added are
net of indirect taxes and subsidies. The sample size runs from 1995q1 until 2013q2. Quarterly changes are measured compared
to the same quarter in the previous year. Due to limited availability of quarterly data, the price of oil is the only other factor
cost that has been taken into account in the regression. Equation (A.9) has been estimated using the Engle-Granger Two-Step
estimation procedure. First, the error correction term ERT (=log(PMCt-1 / Pt-1)) is estimated. Next, the error correction mechanism
(as specified in equation A.9) is estimated for each of the Member States of the euro area for which quarterly data are available
(i.e. all Member States excluding Ireland, Greece and Malta). Implicitly the constant term in the regression covers variables that
can drive a (permanent) discrepancy between prices and nominal unit labour cost, but for which No quarterly data are available.
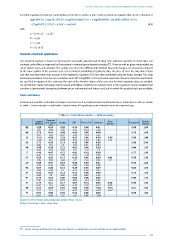
Point estimates
Instrumental variables estimation techniques have been used to avoid potential simultaneity biases. Estimation results are shown
in Table 1. Point estimates in bold with t-values below. All significant point estimates have the expected sign.
Table A.1: Estimation results — total economy
Lagged Nominal Euro Durbin-
inflation unit labour Output ERT Price of oil Constant dummy R-squared Watson
cost
BE 0.28 0.15 0.28 -0.24 0.00 0.01 0.56 1.50
1.87 2.93 3.56 -3.21 -0.53 3.38
DE 0.79 0.04 0.02 -0.14 0.00 0.00 0.72 1.83
9.87 1.02 0.52 -2.33 -1.31 2.23
EE -0.18 0.69 0.31 -0.63 0.01 0.00 0.00 0.92 1.98
-2.18 13.4 10.46 -8.11 2.04 1.65 1.15
ES 0.75 0.10 0.11 -0.13 0.00 0.00 0.88 2.09
6.06 1.15 1.5 -1.31 0.41 0.84
FR 0.68 0.29 0.21 -0.03 0.00 0.00 0.84 1.26
7.43 2.91 3.63 -0.3 -1.12 -1.3
IT 0.40 0.47 0.15 -0.41 -0.01 0.00 0.77 1.42
4.45 7.03 2.98 -2.93 -1.47 0.68
CY 0.52 0.13 0.17 -0.10 0.01 0.00 0.01 0.72 1.76
2.76 3.58 1.63 -1.7 2.18 0.59 1.7
LU 0.28 0.07 0.22 -0.56 0.03 0.01 0.41 1.62
2.29 0.29 0.86 -3.98 1.84 0.98
NL 0.57 0.26 0.21 -0.29 0.01 0.00 0.81 1.66
4.88 2.48 2.7 -3.37 1.18 -0.17
AT 0.61 0.15 0.13 -0.16 0.00 0.00 0.72 1.10
6.69 4.2 3.69 -4.29 0.62 1.59
PT 0.73 0.10 0.05 -0.08 0.00 0.00 0.90 1.34
7.26 2.19 0.73 -0.94 -1.11 1.82
SI 0.75 0.11 0.17 -0.07 -0.01 0.00 0.00 0.93 1.56
8.47 1.61 4.00 -1.10 -2.56 -0.12 0.76
SK 0.27 0.49 0.35 -0.60 0.00 -0.01 -0.01 0.61 1.65
2.27 3.71 2.12 -4.39 0.06 -0.43 -0.47
FI 0.54 0.34 0.20 -0.41 0.00 0.00 0.76 1.96
6.42 4.99 3.52 -3.9 0.06 -1.89
Source: DG EMPL estimates using Eurostat data; sample 1995Q1–2013Q2.
Note: Point estimates in bold, t-values below.
( ) A better measure would have been the output gap. However, as quarterly data are used, such data are not readily available.
89
235
Inserting equation (A.8) into (A.7) and adding a term MU to capture a price mark-up, yields an equation that can be estimated as
log(Pt/Pt-1)= a log( Pt-1/Pt-2)+ b log(NULCt/NULCt-1) + e log[(PXt/PROD_Xt)/ [(PXt-1/PROD_Xt-1)]
+ f log(PMCt-1 / Pt-1) + g MUt + constant (A.9)
with
a= (1-x+x z1 – x y z1)
b= x y g1
e= x y g2
f= x (1-y) z2
Towards empirical application
The empirical analysis is based on harmonised, seasonally-adjusted and working-time adjusted, quarterly Eurostat data. The
89
business cycle effect is measured by fluctuations in national gross domestic product ( ). Prices as well as gross value added are
net of indirect taxes and subsidies. The sample size runs from 1995q1 until 2013q2. Quarterly changes are measured compared
to the same quarter in the previous year. Due to limited availability of quarterly data, the price of oil is the only other factor
cost that has been taken into account in the regression. Equation (A.9) has been estimated using the Engle-Granger Two-Step
estimation procedure. First, the error correction term ERT (=log(PMCt-1 / Pt-1)) is estimated. Next, the error correction mechanism
(as specified in equation A.9) is estimated for each of the Member States of the euro area for which quarterly data are available
(i.e. all Member States excluding Ireland, Greece and Malta). Implicitly the constant term in the regression covers variables that
can drive a (permanent) discrepancy between prices and nominal unit labour cost, but for which No quarterly data are available.
Point estimates
Instrumental variables estimation techniques have been used to avoid potential simultaneity biases. Estimation results are shown
in Table 1. Point estimates in bold with t-values below. All significant point estimates have the expected sign.
Table A.1: Estimation results — total economy
Lagged Nominal Euro Durbin-
inflation unit labour Output ERT Price of oil Constant dummy R-squared Watson
cost
BE 0.28 0.15 0.28 -0.24 0.00 0.01 0.56 1.50
1.87 2.93 3.56 -3.21 -0.53 3.38
DE 0.79 0.04 0.02 -0.14 0.00 0.00 0.72 1.83
9.87 1.02 0.52 -2.33 -1.31 2.23
EE -0.18 0.69 0.31 -0.63 0.01 0.00 0.00 0.92 1.98
-2.18 13.4 10.46 -8.11 2.04 1.65 1.15
ES 0.75 0.10 0.11 -0.13 0.00 0.00 0.88 2.09
6.06 1.15 1.5 -1.31 0.41 0.84
FR 0.68 0.29 0.21 -0.03 0.00 0.00 0.84 1.26
7.43 2.91 3.63 -0.3 -1.12 -1.3
IT 0.40 0.47 0.15 -0.41 -0.01 0.00 0.77 1.42
4.45 7.03 2.98 -2.93 -1.47 0.68
CY 0.52 0.13 0.17 -0.10 0.01 0.00 0.01 0.72 1.76
2.76 3.58 1.63 -1.7 2.18 0.59 1.7
LU 0.28 0.07 0.22 -0.56 0.03 0.01 0.41 1.62
2.29 0.29 0.86 -3.98 1.84 0.98
NL 0.57 0.26 0.21 -0.29 0.01 0.00 0.81 1.66
4.88 2.48 2.7 -3.37 1.18 -0.17
AT 0.61 0.15 0.13 -0.16 0.00 0.00 0.72 1.10
6.69 4.2 3.69 -4.29 0.62 1.59
PT 0.73 0.10 0.05 -0.08 0.00 0.00 0.90 1.34
7.26 2.19 0.73 -0.94 -1.11 1.82
SI 0.75 0.11 0.17 -0.07 -0.01 0.00 0.00 0.93 1.56
8.47 1.61 4.00 -1.10 -2.56 -0.12 0.76
SK 0.27 0.49 0.35 -0.60 0.00 -0.01 -0.01 0.61 1.65
2.27 3.71 2.12 -4.39 0.06 -0.43 -0.47
FI 0.54 0.34 0.20 -0.41 0.00 0.00 0.76 1.96
6.42 4.99 3.52 -3.9 0.06 -1.89
Source: DG EMPL estimates using Eurostat data; sample 1995Q1–2013Q2.
Note: Point estimates in bold, t-values below.
( ) A better measure would have been the output gap. However, as quarterly data are used, such data are not readily available.
89
235