Page 238 - ePaper
P. 238
Employment and Social Developments in Europe 2014
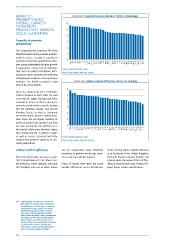
Annex 2: Chart X1: ‘Competitiveness indicator’: 2013–14 rankings
Member States’
overall capacity 6
to promote
productivity growth: 5
2013–14 ranking 4
Capacity to promote 3
productivity
2
90
The ‘competitiveness indicator’ ( ) of the
World Economic Forum provides a bench - 1
mark to assess a country’s capacity to
promote productivity growth that under - 0 CH 1 FI 3 DE 4 US 5 SE 6 NL 8 JP 9 UK 10 NO 11 DK 15 AT 16 BE 17 LU 22 FR 23 IE 28 EE 32 ES 35 MT 41 PL 42 CZ 46 LT 48 IT 49 PT 51 LV 52 BG 57 CY 58 SI 62 HU 63 HR 75 RO 76 SK 78 EL 91
pins strong sustainable inclusive growth.
It aggregates a broad set of indicators Source: World Economic Forum.
that covers a country’s institutions, infra - Note: Country labels with their ranking.
structure, macro-economic environment,
technological readiness, and capacity to
innovate. See World Economic Forum Chart X2: Labour market efficiency: 2013–14 ranking
(2014) for more details.
6
Chart X1 shows how the EU Member
States compare to each other (as well 5
as to the US, Japan, Norway and Swit-
zerland) in terms of their capacity to 4
promote productivity growth. Among 3
the EU Member States, the Nordic
Member States as well as Germany, 2
the Netherlands and the United King-
dom show the strongest capacity to 1
promote productivity growth (and they
are also among the top performers in 0 CH 2 US 4 UK 5
the world), while most Member States DK 13 EE 12 NO 14 IE 16 SE 18 FI 20 NL 21 LU 22 JP 23 LV 26 CY 36 DE 41 MT 43 AT 42 BG 61 BE 64 FR 71 LT 69 SK 76 PL 80 CZ 81 HU 85 SI 106 RO 110 HR 114 ES 115 PT 126 EL 127 IT 137
that joined the EU in 2004 or later,
as well as Greece, Portugal and Italy, Source: World Economic Forum.
showed the weakest capacity to pro- Note: Country labels with their ranking.
mote productivity.
Labour market efficiency can be reallocated, wage flexibility, States. Strong labour market efficiency
incentives to perform on the job, barri- is to be found in the United Kingdom,
One of the dimensions to assess a coun - ers to entry and gender balance. Denmark, Estonia, Ireland, Sweden and
try’s ‘competitiveness’ is its labour mar- Finland, while the weakest form of flex-
ket efficiency, which captures, inter alia, Chart X2 shows that there are some ibility is to be found in Italy, Greece, Por-
the flexibility and cost at which labour notable differences across EU Member tugal, Spain, Croatia and Romania.
( ) Such indicators should not be confused
90
with indicators that measure enterprises’
competitiveness. At the level of countries,
international trade is about a mutually
beneficial exchange in which a country
specialises in the production of goods
and services for which it has a comparative
advantage. In other words, international
trade provides a country (as well as its
trading partner) the opportunity to improve
its production efficiency, thereby also
improving its national productivity level —
see, for instance, Krugman (1994).
236