Page 213 - ePaper
P. 213
Chapter 4: Restoring Convergence between Member States in the EU and EMU
Chart 10: Convergence and divergence of inequalities (S80/S20) in the EU (2004–12)
Dispersion Averages
30 70 8
Average EU-28 EU-15 North
7 EU-15 South EU-13 North
EU-15 Centre EU-13 South
25 50 6
% % 5
20 30 4
3
15 10 2
1995 1996 1997 1998 1999 2000 2001 2002 2003 2004 2005 2006 2007 2008 2009 2010 2011 2012 1995 1996 1997 1998 1999 2000 2001 2002 2003 2004 2005 2006 2007 2008 2009 2010 2011 2012
Reading note: σ values refer to the coefficient of variation (based on weighted averages) and are reported on the left scale. The share of between zones
variance in total is reported on the right axis. The dates correspond to the dates of the SILC waves which refer to households’ incomes on the year before.
Source: Eurostat, calculations DG EMPL.
Notes: σ refers to the coefficient of variation (based on weighted averages); the share of inter groups variance is based on un-weighted averages by zone (see
annex). Some missing values at the beginning of the period were kept constant for the calculation of dispersion and averages: CZ, DE, CY, LV, LT, HU, MT, NL, PL,
SI, SK, UK (2004).
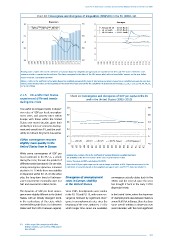
2.1.3. EU and United States Chart 11: Convergence and divergence of GDP per capita in the EU
experienced different trends and in the United States (1995–2013)
during the crisis
It is useful to compare trends in disper- 1.0 0.8
sion rates of GDP per head; unemploy-
ment rates; and poverty rates within 0.8 0.6
Europe with those within the United
States over recent decades given their 0.6 0.4
similarity in terms of economic develop -
13
ment and overall size ( ), and the avail- 0.4 0.2
ability of relevant long-term data series.
0.2 0
GDPpc convergence resumes
slightly more quickly in the 0 -0.2
United States than in Europe 1995 1996 1997 1998 1999 2000 2001 2002 2003 2004 2005 2006 2007 2008 2009 2010 2011 2012 2013
While some convergence of GDP per
Reading note: σ values refer to the coefficient of variation (based on weighted averages).
head continued in the EU as a whole The definition of the five EU-28 zones is the same as in the former section.
during the crisis, this was the product of Source: Eurostat and BEA, calculations DG EMPL.
different trends (see above). On one side, Note: Real GDP per capita expressed in euro in Europe and dollar in USA. Dispersion measured as the
strong convergence dynamics remained coefficient of variation, based on the weighted average of each zone EU-15* does not include LU.
at play in EU-13 while there was stability
in dispersion within EU-15. On the other
side, the long-term trend of between- Divergence of unemployment convergence actually dates back to the
zones convergence eventually came to a rates in Europe, stability 1960s and the reversal since the crisis
halt and reversed in relative terms. in the United States has brought it back to the early 1970s
dispersion levels.
The dynamics of GDP per head conver- Since 1995, developments were similar
gence were slightly different in the United in the EU-28 and EU-15, with some con- In the United States, where the dispersion
States, with an initially divergent trend, vergence followed by significant diver- of unemployment rates between States is
in the early phase of the crisis, which gence in unemployment rates since the around half that in Europe, there has been
reverted afterwards (from 2010 between beginning of the crisis. Within EU-15 (for some overall stability in dispersion over
States and from 2012 between regions). which longer time series are available) recent decades, with the most significant
( ) In this respect the comparison with other
13
federal countries, such as CH or CAN, may be
less relevant.
211
Chart 10: Convergence and divergence of inequalities (S80/S20) in the EU (2004–12)
Dispersion Averages
30 70 8
Average EU-28 EU-15 North
7 EU-15 South EU-13 North
EU-15 Centre EU-13 South
25 50 6
% % 5
20 30 4
3
15 10 2
1995 1996 1997 1998 1999 2000 2001 2002 2003 2004 2005 2006 2007 2008 2009 2010 2011 2012 1995 1996 1997 1998 1999 2000 2001 2002 2003 2004 2005 2006 2007 2008 2009 2010 2011 2012
Reading note: σ values refer to the coefficient of variation (based on weighted averages) and are reported on the left scale. The share of between zones
variance in total is reported on the right axis. The dates correspond to the dates of the SILC waves which refer to households’ incomes on the year before.
Source: Eurostat, calculations DG EMPL.
Notes: σ refers to the coefficient of variation (based on weighted averages); the share of inter groups variance is based on un-weighted averages by zone (see
annex). Some missing values at the beginning of the period were kept constant for the calculation of dispersion and averages: CZ, DE, CY, LV, LT, HU, MT, NL, PL,
SI, SK, UK (2004).
2.1.3. EU and United States Chart 11: Convergence and divergence of GDP per capita in the EU
experienced different trends and in the United States (1995–2013)
during the crisis
It is useful to compare trends in disper- 1.0 0.8
sion rates of GDP per head; unemploy-
ment rates; and poverty rates within 0.8 0.6
Europe with those within the United
States over recent decades given their 0.6 0.4
similarity in terms of economic develop -
13
ment and overall size ( ), and the avail- 0.4 0.2
ability of relevant long-term data series.
0.2 0
GDPpc convergence resumes
slightly more quickly in the 0 -0.2
United States than in Europe 1995 1996 1997 1998 1999 2000 2001 2002 2003 2004 2005 2006 2007 2008 2009 2010 2011 2012 2013
While some convergence of GDP per
Reading note: σ values refer to the coefficient of variation (based on weighted averages).
head continued in the EU as a whole The definition of the five EU-28 zones is the same as in the former section.
during the crisis, this was the product of Source: Eurostat and BEA, calculations DG EMPL.
different trends (see above). On one side, Note: Real GDP per capita expressed in euro in Europe and dollar in USA. Dispersion measured as the
strong convergence dynamics remained coefficient of variation, based on the weighted average of each zone EU-15* does not include LU.
at play in EU-13 while there was stability
in dispersion within EU-15. On the other
side, the long-term trend of between- Divergence of unemployment convergence actually dates back to the
zones convergence eventually came to a rates in Europe, stability 1960s and the reversal since the crisis
halt and reversed in relative terms. in the United States has brought it back to the early 1970s
dispersion levels.
The dynamics of GDP per head conver- Since 1995, developments were similar
gence were slightly different in the United in the EU-28 and EU-15, with some con- In the United States, where the dispersion
States, with an initially divergent trend, vergence followed by significant diver- of unemployment rates between States is
in the early phase of the crisis, which gence in unemployment rates since the around half that in Europe, there has been
reverted afterwards (from 2010 between beginning of the crisis. Within EU-15 (for some overall stability in dispersion over
States and from 2012 between regions). which longer time series are available) recent decades, with the most significant
( ) In this respect the comparison with other
13
federal countries, such as CH or CAN, may be
less relevant.
211