Page 211 - ePaper
P. 211
Chapter 4: Restoring Convergence between Member States in the EU and EMU
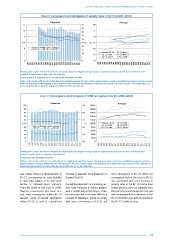
Chart 6: Convergence and divergence of activity rates in the EU (1995–2013)
Dispersion Averages
12 50 80
45
10 40 75
8 35 70
30
6 % 25 % % 65
20
4 15 60
10 Average EU-28 EU-15 North
2 55 EU-15 South EU-13 North
5 EU-15 Centre EU-13 South
0 0 50
1990 1991 1992 1993 1994 1995 1996 1997 1998 1999 2000 2001 2002 2003 2004 2005 2006 2007 2008 2009 2010 2011 2012 2013 1990 1991 1992 1993 1994 1995 1996 1997 1998 1999 2000 2001 2002 2003 2004 2005 2006 2007 2008 2009 2010 2011 2012 2013
Reading note: σ values refer to the coefficient of variation (based on weighted averages) and are reported on the left scale. The share of between zones
variance in total variance is reported on the right axis.
Source: Eurostat, employment rate 15–64 age bracket, calculations DG EMPL.
Note: σ refers to the coefficient of variation (based on weighted averages); the share of inter groups variance is based on unweighted averages by zone (see annex).
Some missing values in the beginning of the period were kept constant for the calculation of dispersion and averages: HR (1995-01), BG, CY, MT (1995-99), CZ, EE,
LV, LT, SK (1995-97), PL, RO (1995-96), HU, SI (1995), IT (1992), AT (1992-93).
Chart 7: Convergence and divergence of GHDI per capita in the EU (1995–2013)
Dispersion Averages
100 90 20000
90 18000
80 80 16000
70 14000
60 70 12000
% 50 % 10000 Average EU-28 EU-15 North
EU-13 North
EU-15 South
40 60 8000 EU-15 Centre EU-13 South
30 6000
20 50 4000
10 2000
0 40 0
1995 1996 1997 1998 1999 2000 2001 2002 2003 2004 2005 2006 2007 2008 2009 2010 2011 2012 2013 1995 1996 1997 1998 1999 2000 2001 2002 2003 2004 2005 2006 2007 2008 2009 2010 2011 2012 2013
Reading note: σ values refer to the coefficient of variation (based on weighted averages) and are reported on the left scale. The share of between zones
variance in total variance is reported on the right axis.
Source: Eurostat, calculations DG EMPL.
Notes: σ refers to the coefficient of variation (based on weighted averages); the share of inter groups variance is based on unweighted averages by zone (see
annex). Values in real euros deflated by HICP. Missing data for MT, some missing values in the beginning of the period were kept constant for the calculation of
dispersion and averages: LU (1996-2005), BG, HR, IE (1996-01), EL, ES, RO (1996-99).
was mainly driven by developments in increase in between-zone dispersion in some divergence in EU-15. While the
EU-13, accompanied by some stability Europe (Chart 8). convergence before the crisis in EU-15
in dispersion within EU-15 and some was associated with some increase in
decline in between-zones variance. Overall developments in monetary pov- poverty rates in the EU-15 Centre zone
Since the onset of the crisis in 2008, erty have followed a similar pattern, (where poverty rates are relatively low),
however, convergence has come to a with a stabilisation in the degree of dis- this increase paused during the crisis and
halt, with convergence within EU-13 persion since the crisis that reflects a was accompanied by a decrease in the
paused, some increased divergence reversal of dispersion trends by zones, EU-15 Northern zone and an increase in
within EU-15, as well as a significant with some convergence in EU-13 and the EU-15 Southern zone.
209