Page 209 - ePaper
P. 209
Chapter 4: Restoring Convergence between Member States in the EU and EMU
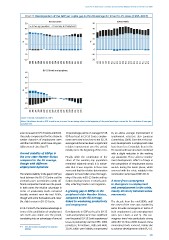
Chart 3: Decomposition of the GDP per capita gap to EU-28 average for three EU-15 zones (1995–2013)
EU-15 Centre EU-15 North
50 50
Active age population Productivity Employment
40 40
30 30
20 20
% %
10 10
0 0
-10 -10
-20 -20
1995 1996 1997 1998 1999 2000 2001 2002 2003 2004 2005 2006 2007 2008 2009 2010 2011 2012 2013 1995 1996 1997 1998 1999 2000 2001 2002 2003 2004 2005 2006 2007 2008 2009 2010 2011 2012 2013
EU-15 South and periphery
50
40
30
20
%
10
0
-10
-20
1995 1996 1997 1998 1999 2000 2001 2002 2003 2004 2005 2006 2007 2008 2009 2010 2011 2012 2013
Source: Eurostat, calculations DG EMPL.
Notes: Calculations based on GDP in real terms, in euros. Some missing values in the beginning of the period were kept constant for the calculation of averages:
EL (1995-97).
even increased in EU-13 Centre and North. 10 percentage points of average EU-28 by an above average improvement in
This partly compensated for the relatively GDP per head. In EU-15 Centre, employ- employment rates (see also European
weaker dynamics of employment rates ment rates used to be close to the EU-28 Commission, 2008). Since the crisis, how -
until the mid-2000s, which have only par- average but there has been a significant ever, developments in employment rates
tially reversed since then ( ). relative improvement over the period, have been less favourable than in the
12
notably since the beginning of the crisis. EU overall and have also been combined
Overall stability of GDPpc in with a slight reduction in the working
the core older Member States Finally, while the contribution of the age population. These adverse employ-
compared to the EU average, share of the working age population ment developments reflect a change in
though with different remained relatively small, it is notice- the composition of employment across
employment dynamics able that it was negative in these two sectors during the boom phase, which
zones and that the relative deterioration reversed with the crisis, notably in the
The relative stability in the gap in GDP per appears to have fallen since the begin- construction sector (see ESDE 2013).
head between the EU-15 Centre and the ning of the crisis in EU-15 Centre and has
EU North zones nevertheless masks dif- further developed in EU-15 North, prob- A move from convergence
ferent composition trends over the period. ably reflecting trends in net migration. to divergence in employment
In both zones the relative advantage in and unemployment in the crisis,
terms of productivity levels remained A growing gap in GDPpc in the mostly driven by between-zones
broadly constant since the mid-1990s, peripheral older Member States, movements
though with some fluctuations and, nota - compared to the EU average,
bly, slight erosion in EU-15 Centre. linked to weakening productivity The decade from the mid-1990s until
and employment the onset of the crisis was marked by
In EU-15 North, the relative advantage in some EU-wide convergence in terms of
terms of the contribution of employment Developments in GDP per head in EU-15 both employment and unemployment
rate levels was stable over the period, South and periphery were more significant rates (see Charts 4 and 5). This con -
translating into an advantage of around over the period. EU-15 South experienced vergence trend was particularly strong
losses in productivity over the 1995–2004 within EU-15. Since 2008, however, these
period (see, for instance, Balta and Mohl, converging trends reversed, mainly due
( ) See, for instance, European Commission
12
(2009). 2014), which were initially compensated to adverse developments within EU-15.
207