Page 210 - ePaper
P. 210
Employment and Social Developments in Europe 2014
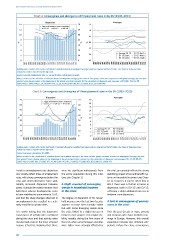
Chart 4: Convergence and divergence of Employment rates in the EU (1995–2013)
Dispersion Averages
14 70 75
12 60 70
10 50
65
8 40
% % % 60
6 30
55
4 20
Average EU-28 EU-15 North
2 10 50 EU-15 South EU-13 North
EU-15 Centre EU-13 South
0 0 45
1990 1991 1992 1993 1994 1995 1996 1997 1998 1999 2000 2001 2002 2003 2004 2005 2006 2007 2008 2009 2010 2011 2012 2013 1990 1991 1992 1993 1994 1995 1996 1997 1998 1999 2000 2001 2002 2003 2004 2005 2006 2007 2008 2009 2010 2011 2012 2013
Reading note: σ values refer to the coefficient of variation (based on weighted averages) and are reported on the left scale. The share of between zones
variance in total is reported on the right axis.
Source: Eurostat, employment rate 15–64 age bracket, calculations DG EMPL.
Notes: σ refers to the coefficient of variation (based on weighted averages); the share of inter groups variance is based on un-weighted averages by zone (see
annex). Some missing values in the beginning of the period were kept constant for the calculation of dispersion and averages: s HR (1995-01), BG, MT
(1995-99), CY (1995-98), LT, LV, SK (1995-97), CZ, EE, PL, RO (1995-96), HU, SI (1995), AT, FI, SE (1990-94).
Chart 5: Convergence and divergence of Unemployment rates in the EU (1995–2013)
Dispersion Averages
70 70 20
18
60 60
16
50 50 14
40 40 12
% % 10
30 30 8
20 20 6
4 Average EU-28 EU-15 North
10 10 EU-15 South EU-13 North
2 EU-15 Centre EU-13 South
0 0 0
1990 1991 1992 1993 1994 1995 1996 1997 1998 1999 2000 2001 2002 2003 2004 2005 2006 2007 2008 2009 2010 2011 2012 2013 1990 1991 1992 1993 1994 1995 1996 1997 1998 1999 2000 2001 2002 2003 2004 2005 2006 2007 2008 2009 2010 2011 2012 2013
Reading note: σ values refer to the coefficient of variation (based on weighted averages) and are reported on the left scale. The share of between zones
variance in total is reported on the right axis.
Source: Eurostat, calculations DG EMPL.
Notes: σ refers to the coefficient of variation (based on weighted averages); the share of inter groups variance is based on unweighted averages by zone
(see annex). Some missing values in the beginning of the period were kept constant for the calculation of dispersion and averages: BG, CY, EE, HR, MT
(1995-99), LV (1995-98), LT (1995-97), PL, RO (1995-96), HU, SI (1995), AT (1990-93), DE (1990), EL (1990-97).
Trends in unemployment rate dispersion were No significant withdrawals from the crisis, presumably reflects the strong
very closely reflect those of employment the active population during this crisis stabilising impact of tax and benefit sys -
rates, with strong convergence before the (see also Chapter 1). tems on household incomes (see Chap-
crisis and strong divergence since, with, ter 1). However, it can be noted that in
notably increased dispersion between A slight reversal of converging 2012 there was a further increase in
zones. It should be noted, however, that trends in household incomes dispersion, both in EU-13 and EU-15,
both these adverse developments seem in the crisis reflecting a slight additional increase in
to have stabilised to some extent in 2013, between-zone dispersion.
and that the sharp changes observed in The degree of dispersion of EU house-
unemployment rates resulted in a rela - hold incomes over the last two decades A halt in convergence of poverty
tively small fall in activity rates. appears to have been broadly stable rates in the crisis
but with some diverging trends since
It is worth noting that the long-term the crisis, linked to a slight increase in Over the past decade or more, poverty
convergence of activity rates continued between-zone variance. This relative sta - and exclusion rates have tended to con-
during the crisis and that activity rates bility, notably during the first years of verge in Europe. However, this overall
resisted well, even in the most affected the crisis when some European countries experience includes two different sub-
regions (Chart 6), implying that there were rather more strongly affected by periods. Before the crisis, convergence
208