Page 212 - ePaper
P. 212
Employment and Social Developments in Europe 2014
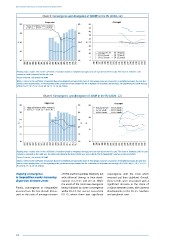
Chart 8: Convergence and divergence of AROPE in the EU (2004–12)
Dispersion Averages
50 60 50
45
40
40 50
35
30
30 40 % % 25
%
20
15
20 30
10 Average EU-28 EU-15 North
5 EU-15 South EU-13 North
EU-13 South
EU-15 Centre
10 20 0
1995 1996 1997 1998 1999 2000 2001 2002 2003 2004 2005 2006 2007 2008 2009 2010 2011 2012 2013 1995 1996 1997 1998 1999 2000 2001 2002 2003 2004 2005 2006 2007 2008 2009 2010 2011 2012 2013
Reading note: σ values refer to the coefficient of variation (based on weighted averages) and are reported on the left scale. The share of between zones
variance in total is reported on the right axis.
Source: Eurostat, calculations DG EMPL.
Notes: σ refers to the coefficient of variation (based on weighted averages); the share of inter groups variance is based on un-weighted averages by zone (see
annex). Some missing values at the beginning of the period were kept constant for the calculation of dispersion and averages: HR (2004-09), RO (2004-06), BG
(2004-05), CZ, DE, CY, LV, LT, HU, MT, NL, PL, SI, SK, UK (2004).
Chart 9: Convergence and divergence of AROP in the EU (2004–12)
Dispersion Averages
35 70 25
Average EU-28 EU-15 North
EU-15 South EU-13 North
30 60 EU-15 Centre EU-13 South
20
25 50
% % %
20 40
15
15 30
10 20 10
1995 1996 1997 1998 1999 2000 2001 2002 2003 2004 2005 2006 2007 2008 2009 2010 2011 2012 2013 1995 1996 1997 1998 1999 2000 2001 2002 2003 2004 2005 2006 2007 2008 2009 2010 2011 2012 2013
Reading note: σ values refer to the coefficient of variation (based on weighted averages) and are reported on the left scale. The share of between zones in total
variance is reported on the right axis. The dates correspond to the dates of the SILC waves which refer to households’ incomes on the year before.
Source: Eurostat, calculations DG EMPL.
Notes: σ refers to the coefficient of variation (based on weighted averages); the share of inter groups variance is based on un-weighted averages by zone (see
annex). Some missing values at the beginning of the period were kept constant for the calculation of dispersion and averages: RO (2005-06), CZ, DE, CY, LV, LT,
HU, MT, NL, PL, SI, SK, UK (2004).
Ongoing convergence of fifth and first quintiles S80/S20), but convergence until the crisis which
in inequalities masks increasing with different timings in their devel- reversed and then stabilised. Overall,
dispersion between zones opment in EU-13 and EU-15. While these trends were associated with a
the onset of the crisis saw divergence significant increase in the share of
Finally, convergence in inequalities being followed by some convergence variance between zones, with adverse
occurred over the last decade (meas- within EU-13, the reverse occurred in developments in the EU-15 Southern
ured as the ratio of average incomes EU-15, where there was significant and peripheral zone.
210