Page 214 - ePaper
P. 214
Employment and Social Developments in Europe 2014
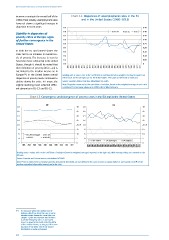
increase occurring in the second half of the Chart 12: Dispersion of unemployment rates in the EU
1980s. Most notably, unemployment rates and in the United States (1960–2013)
have not shown a significant increase in
dispersion in recent years. 0.9 0.45
0.8 0.40
Stability in dispersion of
poverty rates in Europe, signs 0.7 0.35
of further convergence in the 0.6 0.30
United States 0.5 0.25
0.4 0.20
In both the EU and United States the 0.3 0.15
crisis led to an increase in overall lev- 0.2 0.10
els of poverty. The increase is seen to
have been more substantial in the United 0.1 0.05
States, though it should be noted that 0.0 0
their definition of poverty differs and is 1960 1962 1964 1966 1968 1970 1972 1974 1976 1978 1980 1982 1984 1986 1988 1990 1992 1994 1996 1998 2000 2002 2004 2006 2008 2010 2012
not linked to the median income as in
14
Europe ( ). In the United States overall Reading note: σ values refer to the coefficient of variation (based on weighted averages) reported on
dispersion of poverty levels continued to the left axis for EU and right axis for the United States. The scales are different on both axis.
decline during the crisis. In Europe, the Source: Eurostat, AMECO and DoL, calculations DG EMPL.
slightly declining trend reflected differ- Note: Dispersion measured as the coefficient of variation, based on the weighted average of each zone
ent dynamics in EU-13 and EU-15. considered. For Germany, values up to 1989 refer to West Germany.
Chart 13: Convergence and divergence of poverty rates in the EU and in the United States
EU US
18 40 18 40
16 35 16 35
14 30 14 30
12 25 12 25
10 20 % 10 20 %
8 15 8 15
6 10 6 10
4 5 4 5
2 0 2
2003 2004 2005 2006 2007 2008 2009 2010 2011 2012 1980 1981 1982 1983 1984 1985 1986 1987 1988 1989 1990 1991 1992 1993 1994 1995 1996 1997 1998 1999 2000 2001 2002 2003 2004 2005 2006 2007 2008 2009 2010 2011 2012 0
Reading note: σ values refer to the coefficient of variation (based on weighted averages) reported on the right axis, while average values are reported on the
left axis.
Source: Eurostat and Census bureau, calculations DG EMPL.
Note: Poverty relates here to monetary poverty and poverty thresholds are not defined in the same manner in Europe (where it corresponds to 60 % of the
median equivalised disposable income) and in the USA.
14
( ) For instance, when the median income
declines, which has been the case in some
Member States during this crisis (also see
Chapter 1), this can translate into declines
in at-risk-of-poverty rates as measured
based on poverty threshold reflecting 60 %
of the median income, as long as the income
situation of the lower end of the income
distribution remains unchanged.
212