Page 216 - ePaper
P. 216
Employment and Social Developments in Europe 2014
affect the Member State’s overall pro- Chart 15: Nominal unit labour cost and its components —
ductivity level. Another approach would EA-18 cumulative growth 2008–13
be to increase productivity in Member
States where unit labour cost growth 40
was too strong, which would increase Productivity Nominal ULC
the Member State’s overall productivity 30 Compensation per employee Just below 2% per annum cumulative
level — thereby potentially strengthen-
ing upward convergence. 20
% 10
... mainly corrected
by adjustments in nominal 0
compensation per employee …
-10
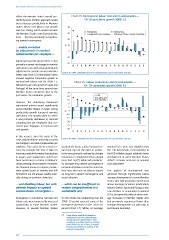
Adjustment over the period 2008–13 has
primarily occurred via changes in nominal -20 LU FI EE BE MT AT SI NL DE IT FR SK LV PT CY ES EL IE
unit labour costs, with strong downwards
adjustment in several euro area Member Source: DG EMPL calculations based on Eurostat (nama_aux_lp and nama_aux_ulc).
States (see Chart 15). Ireland and Greece
showed negative cumulative growth in
nominal unit labour cost for 2008–13, Chart 16: Labour productivity and its components —
followed by very low growth in Spain and EA–18 cumulative growth 2008–13
Portugal. At the same time, several core
Member States remained close to the 20
just below 2 % cumulative growth. 15 GDP
Productivity
10 Employment
However, the underlying downward 5
adjustment pattern varied significantly 0
across Member States. In Spain strong -5
productivity growth tempered nominal %
unit labour cost growth, while in Greece -10
it was primarily decreases in nominal -15
compensation per employee that cor - -20
rected past slippages in nominal unit -25
cost growth. -30
ES SK LV PT IE CY EE FR SI DE NL BE MT AT IT FI EL LU
In this respect, since the onset of the
crisis, adjustment has primarily occurred Source: DG EMPL calculations based on Eurostat (nama_aux_lp and nama_aux_ulc).
via changes in nominal compensation per
employee. This can be due to several rea - (particularly Spain, Latvia, Portugal, Ire- nominal ULCs were very slightly below
sons, for example the time it takes to land and Cyprus) the gains in produc- the 2 % benchmark, corresponding to
improve productivity means that declines tivity were primarily realised by sharper the ECB inflation target, relatively lower
in wages and employment could have reductions in employment than output development in some Member States
18
been necessary to restore ‘confidence’ (see Chart 16) ( ). While such productiv- reflects stronger increases in nominal
under pressing circumstances. Moreover, ity increases may restore convergence in ULCs elsewhere.
the financial means to improve produc- nominal unit labour cost in the short run,
tivity growth (such as training and skill they may also have an adverse impact This pattern of development was
formation) are not always readily avail- on long-term upward convergence and achieved through significantly below
able during an economic downturn. social cohesion. average developments in some Member
States who had previously experienced
… and shedding labour, but with … which can be insufficient to above average increases (particularly
adverse impacts on upward restore competitiveness in a Ireland, Greece, Spain and Portugal, who
socioeconomic convergence … sustainable way saw declines or stagnation in nominal
ULCs), but generally without above aver -
Divergence in cumulative nominal unit On the whole, the rebalancing over the age increases in Member States who
labour costs were tempered by increased 2008–13 period reversed some of the had previously experienced lower than
productivity in some Member States. divergence observed in the 2001–07 average developments (in particular in
However, in several Member States period (Chart 17). While, on average, Austria and Germany).
18
( ) It can also be noted that changes in
employment can have affected more
specifically lower productivity sectors,
resulting in a positive impact on average
productivity (see, for instance, European
Commission, 2014a, for analysis of the
sectoral composition).
214
affect the Member State’s overall pro- Chart 15: Nominal unit labour cost and its components —
ductivity level. Another approach would EA-18 cumulative growth 2008–13
be to increase productivity in Member
States where unit labour cost growth 40
was too strong, which would increase Productivity Nominal ULC
the Member State’s overall productivity 30 Compensation per employee Just below 2% per annum cumulative
level — thereby potentially strengthen-
ing upward convergence. 20
% 10
... mainly corrected
by adjustments in nominal 0
compensation per employee …
-10
Adjustment over the period 2008–13 has
primarily occurred via changes in nominal -20 LU FI EE BE MT AT SI NL DE IT FR SK LV PT CY ES EL IE
unit labour costs, with strong downwards
adjustment in several euro area Member Source: DG EMPL calculations based on Eurostat (nama_aux_lp and nama_aux_ulc).
States (see Chart 15). Ireland and Greece
showed negative cumulative growth in
nominal unit labour cost for 2008–13, Chart 16: Labour productivity and its components —
followed by very low growth in Spain and EA–18 cumulative growth 2008–13
Portugal. At the same time, several core
Member States remained close to the 20
just below 2 % cumulative growth. 15 GDP
Productivity
10 Employment
However, the underlying downward 5
adjustment pattern varied significantly 0
across Member States. In Spain strong -5
productivity growth tempered nominal %
unit labour cost growth, while in Greece -10
it was primarily decreases in nominal -15
compensation per employee that cor - -20
rected past slippages in nominal unit -25
cost growth. -30
ES SK LV PT IE CY EE FR SI DE NL BE MT AT IT FI EL LU
In this respect, since the onset of the
crisis, adjustment has primarily occurred Source: DG EMPL calculations based on Eurostat (nama_aux_lp and nama_aux_ulc).
via changes in nominal compensation per
employee. This can be due to several rea - (particularly Spain, Latvia, Portugal, Ire- nominal ULCs were very slightly below
sons, for example the time it takes to land and Cyprus) the gains in produc- the 2 % benchmark, corresponding to
improve productivity means that declines tivity were primarily realised by sharper the ECB inflation target, relatively lower
in wages and employment could have reductions in employment than output development in some Member States
18
been necessary to restore ‘confidence’ (see Chart 16) ( ). While such productiv- reflects stronger increases in nominal
under pressing circumstances. Moreover, ity increases may restore convergence in ULCs elsewhere.
the financial means to improve produc- nominal unit labour cost in the short run,
tivity growth (such as training and skill they may also have an adverse impact This pattern of development was
formation) are not always readily avail- on long-term upward convergence and achieved through significantly below
able during an economic downturn. social cohesion. average developments in some Member
States who had previously experienced
… and shedding labour, but with … which can be insufficient to above average increases (particularly
adverse impacts on upward restore competitiveness in a Ireland, Greece, Spain and Portugal, who
socioeconomic convergence … sustainable way saw declines or stagnation in nominal
ULCs), but generally without above aver -
Divergence in cumulative nominal unit On the whole, the rebalancing over the age increases in Member States who
labour costs were tempered by increased 2008–13 period reversed some of the had previously experienced lower than
productivity in some Member States. divergence observed in the 2001–07 average developments (in particular in
However, in several Member States period (Chart 17). While, on average, Austria and Germany).
18
( ) It can also be noted that changes in
employment can have affected more
specifically lower productivity sectors,
resulting in a positive impact on average
productivity (see, for instance, European
Commission, 2014a, for analysis of the
sectoral composition).
214