Page 217 - ePaper
P. 217
Chapter 4: Restoring Convergence between Member States in the EU and EMU
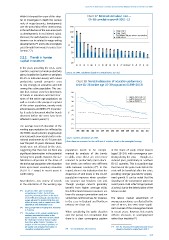
While it is beyond the scope of this chap- Chart 17: Nominal unit labour cost —
ter to investigate in depth the various EA-18 cumulative growth 2001–13
roots of wage dynamics, developments
over the period also reflect shortcomings 120
in the architecture of the euro area (such 100 2008-2013
as developments in real interest rates). 2001-2007
Just below 2% per annum cumulative
Moreover, the underlying loss of competi - 80 2001-2013
tiveness can be related to wage setting 60
developments ( ) and to the incomplete %
19
pass through from wages to prices (see 40
Section 2.2).
20
2.2.2. Trends in human 0
capital investment -20
LV EE LU SI MT IT FI SK BE NL FR IE CY EA-18 EA-12 ES AT PT EL DE
In the years preceding the crisis, some
countries experienced weak productivity Source: DG EMPL calculations based on Eurostat (nama_aux_ulc).
gains, (notably the Southern or periphery
EU-15 as indicated above), with future
productivity growth prospects seen Chart 18: Trends in dispersion of education performance
to rely strongly on education and skill in the EU-28 (active age 16–39 population) (1999–2013)
among the active population. This sec-
tion thus reviews some key dimensions 50
of trends in education and skill struc- 45
tures of the active age population, as Sigma ISCED (0-2)
Sigma ISCED (3-4)
well as trends in the youngest segment 40 Sigma ISCED 5+
of the active population, namely early 35
20
school leavers and NEETs ( ). In particu- 30
lar, it seeks to document whether trends %
observed before the crisis have been 25
affected in recent years ( ). 20
21
15
The average level of education of the
working age population (as reflected by 10 1999 2000 2001 2002 2003 2004 2005 2006 2007 2008 2009 2010 2011 2012 2013
the ISCED classification) is progressively
increasing with convergent trends in edu - Source: Eurostat, calculations DG EMPL.
cational attainments by 16–39 year olds Note: dispersion measured as the coefficient of variation, based on the unweighted average.
over the past 15 years. Moreover, these
trends were not affected by the crisis,
suggesting that there has not been any population needs to be comple- in the share of early school leavers
significant deterioration in the potential mented by analysis of the trends
(aged 18–24), with convergence con -
for long-term growth. However, the sta- in skills, since these are even more tinuing during the crisis — though at a
bilisation in dispersion of the share of relevant to productivity (and educa- reduced pace, particularly in Southern
the active age population with education tion levels can reflect very different EU-15 countries. This is a positive sign
22
levels up to lower secondary education skills between countries) ( ). In this that most of the gains made before the
(ISCED 0–2 range) in recent years is regard, there is No indication that the crisis will be beneficial after the crisis,
worth noting. dispersion of skill levels in the 16–64 providing stronger grounds for employ-
population improves when consider- ment growth. It can be noted that the
Nevertheless, any review of trends ing younger age brackets (16–24). slowdown of the convergence pattern in
in the education of the working age Though younger cohorts generally recent years could reflect longer periods
benefit from higher average skills, at school, due to the deterioration of the
( ) As well as either price or non-price the differentials between countries are labour market.
19
competiveness factors. For instance,
assessing external positions on the basis lower for younger generations and are
of real effective exchange rates (based on sometimes reinforced (as, for instance, The labour market attachment of
wages adjusted for productivity) does not
reflect all costs, such as capital costs, R&D in the case in England and Northern younger generations, as reflected by the
expenditure and distribution costs. Ireland, see Chart 18). rate of NEETs, has seen some signifi-
( ) Young people Not in Employment, Education cant reversal of the convergence trends
20
or Training.
( ) The analysis in this section complements When considering the youth situation in recent years. However, this mainly
21
analyses presented elsewhere in this over the period, it is remarkable that reflects increases in unemployment
report. Chapter 2 discusses in more detail there is a clear convergence pattern rather than inactivity ( ).
23
the challenges to future human capital
formation, while Chapter 3 provides an
analysis of the increasing importance of
job quality and workplace innovation to ( ) See, for instance, EU Employment and Social
23
strengthen productivity growth. ( ) See, for instance, OECD (2012). situation, Quarterly review, March 2014.
22
215