Page 222 - ePaper
P. 222
Employment and Social Developments in Europe 2014
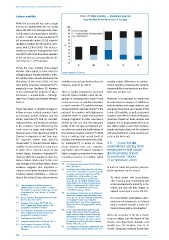
Labour mobility Chart 25: Risk sharing — insurance against
income shocks remains low in Europe
While the last decade has seen a large
increase in mobility within the EU, mostly 100
due to the 2004–07 enlargements, there 90 Fiscal transfers
is still scope to increase labour mobility. 80 Capital markets and depreciation
29
In 2013, 3.3 % of the total population ( ) 70 Credit markets
(of economically active EU-28 citizens) 60
resided in another EU-28 country, com- % 50
pared with 2.1 % in 2005. This increase 40
mainly occurred post-enlargement (2004 30
and 2007) with more than three quarters 20
of this net increase corresponding to citi - 10
30
zens from EU-12 ( ) countries. 0
-10
EU EMU CA US DE
During the crisis, mobility flows helped
Member States adjust, to some extent, to Source: Allard et al. (2013).
changing labour market conditions. Intra-
EU mobility flows actually declined in the
first phase of the crisis (2009–10), but mobility seems to have declined (see, for notably include differences in adminis-
have partly recovered subsequently ( ), instance, Jauer et al., 2014). tration, taxation, social security systems,
31
especially from Southern EU Member transferability of professional qualifica-
States (although the majority of intra- There is further potential for increased tions (see Section 3.2).
EU movers — around 60 % — still origi- intra-EU labour mobility. Given the dis-
nate from Central and Eastern Member parities in unemployment rates ( ) and Moreover, it is important to monitor the
36
States). recent increases in mobility intentions broader long-term impact of mobility on
in some countries ( ), mobility changes both destination and origin countries, and
37
There has been a notable increase in remain limited in absolute terms ( ). The recognise that there are natural limits
38
inflows in more resilient countries (such potential for countries with high unem- to intra-EU mobility, as well as potential
as Germany, Austria, Belgium and the ployment levels to tackle that problem negative side effects in both destination
32
Nordic countries) ( ) and, by contrast, through migration to other countries is countries (impact on local services and
reduced inflows and increased outflows limited by the fact that the education budgets, risk of displacement effects on
in the countries most affected by the profile of the average unemployed per- low-skilled natives) and origin countries
crisis (such as Spain and Ireland ( )). son does not match the profile needs of (youth and brain drain, risk for cohesion
33
However, part of this adjustment reflects the potential recipient country ( ). While and sustainability of social security sys-
39
changes in migration to and from non- there is evidence that current levels of tems in the long-run).
EU countries, rather than intra-EU
mobility are below the measured mobil-
40
movements ( ). Overall, intra-EU labour ity intentions ( ) in terms of move- 3.2. Cross-border
34
mobility remains limited, in comparison ments between euro area countries, externalities arising from
to other OECD countries (such as the any further intra-EU labour mobility is employment and social
35
United States, Canada or Australia) ( ). likely to require a reduction in the many developments linked
However, while the migration response to remaining barriers to mobility, which to economic shocks
labour market shocks prior to the crisis in a monetary union
was stronger in the United States, recent ( ) See European Commission (2014a), Boxes 2
36
evidence suggests that migration in 37 and 3, pp. 282–6. In terms of future perspectives, two par -
Europe reacted quite strongly to changes ( ) According to the Gallup Word Poll, the share ticular questions can be raised:
of EU citizens planning to move permanently
in labour market conditions — more so in another country increased from 0.5 %
than in the United States, where internal in 2008–10 to 1.2 % in 2011–12, see • To what extent will cross-border
European Commission, EU ESSQR June
2013, pp. 38–50. Another indicator is the effects arising from employment and
rising number of EU citizens registering in
( ) Corresponding to 8 million persons; in EURES CV online (from 761 000 in June social developments intensify in the
29
addition, there are also around 1.1 million 2012 to 1 035 000 in June 2013 and future, and how will they impact on
EU inhabitants working outside their country 1 160 000 in January 2014). upward convergence across the EU?
of residence (i.e. ‘cross-border’ or ‘frontier’ ( ) See European Commission, EU Employment
38
workers). and Social Situation Quarterly Report, June
30
( ) EU-12: countries that joined the EU in 2004 2013, pp. 38–50 and European Commission, • Do cross-border externalities stem-
(EU-10) and 2007 (EU-2). EU Employment and Social Situation ming from developments in national
31
( ) European Commission, EU ESSQR June Quarterly Report June 2014, Supplement
2014, Supplement ‘Recent trends in the ‘Recent trends in the geographical mobility labour markets provide a basis for
geographical mobility of workers’. of workers’. more EU-level policy coordination?
39
( ) See European Commission, EU ESSQR June ( ) EU-LFS data indicate that most (around
32
2014, Supplement ‘Recent trends in the 60 %) recent movers from the South are
geographical mobility of workers’. highly educated while around 80 % of the When an economy is hit by a shock,
( ) See Deutsche Bank (2011). unemployed in Southern countries have a it has to adjust, but the nature of the
33
low or medium level of education, see EU
( ) European Commission (2014a), pp. 281–6. Employment and Social Situation Quarterly shocks and adjustment channels vary
34
35
( ) See European Commission (2014a), Report, June 2013, p. 45. greatly (see, for instance, Box 2). In
pp. 282–3 for a recent review of the ( ) See European Commission, Employment and
40
literature. Social Situation Quarterly Report, June 2013. closely integrated national economies,
220