Page 52 - ePaper
P. 52
Employment and Social Developments in Europe 2014
from the labour market, resulting in their their employment rate (–4.8 pps), indicat - Since 2008, the activity rates of older
decline between 1990 and 1994 and a ing that they were the group least likely to workers (55–64) increased substan-
very slow return to previous levels, sub- fall into inactivity if they lost their job. LFS tially in most countries even in the
37
stantially so for Sweden and Finland, data for 2013 also shows that, if prime- most affected countries ( ) while they
while increasing slightly in France (and the age men become unemployed, they are had been decreasing during the 1990s
38
United States), see Chart 14. By contrast, more likely to receive unemployment ben - recession ( ). Several changes explain
since 2007, activity rates have continued efits (43 %) than young people (18 %) or this difference.
to increase in many EU countries, even prime-age women (36 %), notably due
those strongly affected by the recession. to their more favourable employment • Older workers have been (in com-
histories. This is one of the factors that parison to the 1990s) less affected
Increase in activity continued promote continuation of job search rather by job losses (see Chart 18) nota-
to be driven by women and older than ‘discouragement’ and inactivity. bly because their educational levels
workers
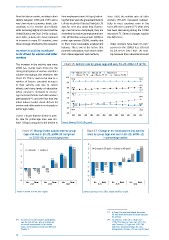
The increase in the activity rate since Chart 15: Activity rate by group (age and sex), EU-28, 2002–13 (in %)
2008 has mainly been driven by the
rising participation of women and older Men 15-24 Men 25-49 Men 50-64
workers throughout the recession see Women 15-24 Women 25-49 Women 50-64
Chart 15. This is seen to be due to a 100 92.6 92.0
number of factors: structural increases 90
in their activity rate due to cohort 79.7
effects and rising levels of education; 80 75.7 72.1
policy measures designed to encour - 70
age increased female and older workers 64.3 56.9
36
participation( ); and the fact that the 60
initial labour market shock did not hit 50 48.3 44.9
women and older workers as strongly as 43.4
prime-age males. 40 40.9 39.3
30
Chart 17 shows that the decline in activ- 2002 2003 2004 2005 2006 2007 2008 2009 2010 2011 2012 2013
ity rate for prime-age men was lim-
ited (–0.8 pp) compared to the decline in Source: Eurostat, EU-LFS, [lfsi_agan].
Chart 16: Change in the activity rate by group Chart 17: Change in the employment and activity
(age and sex) in EU-28, 2008–13 compared rates by group (age and sex) in EU-28, 2008–13,
to 2002–08, in percentage points in percentage points
8 7.2 8
6.3 6 Changes in ER (pps) Changes in AR (pps) 6.3
6 2002-08 2008-13 4.9
4.5 4 3.3
4 3.3 2
2.6 1.4 0.9
2 1.4 0
0.2 -2 -1.4 -0.8 -1.6
0
-0.6 -0.2 -0.8 -4 -2.8 -3.9
-2 -1.4 -6 -4.8
-2.8 -6.1
-4 -8
Men Women Men Women Men Women Men Women Men Women Men Women
15-24 25-49 50-64 15-24 25-49 50-64
Source: Eurostat, EU-LFS, [lfsa_argan]. Source: Eurostat, EU-LFS, [lfsa_argan] and [lfsa_ergan].
37
( ) In Spain, Portugal and Ireland, decreases
for men were more than offset by increases
for women.
38
36
( ) The increase in older workers participation ( ) For instance: in the UK (–1.6 pps over
over the last decades was also driven by 1990–95), Italy (–4.2 pps over 1991–95)
an overall improvement in their health and Germany (–2.9 pps over 1992–96)
status, see European Commission (2011a), with more pronounced drops for men
Chapter 5. (respectively –5.8 pps, –7.3 pps and 4.9 pps).
50
from the labour market, resulting in their their employment rate (–4.8 pps), indicat - Since 2008, the activity rates of older
decline between 1990 and 1994 and a ing that they were the group least likely to workers (55–64) increased substan-
very slow return to previous levels, sub- fall into inactivity if they lost their job. LFS tially in most countries even in the
37
stantially so for Sweden and Finland, data for 2013 also shows that, if prime- most affected countries ( ) while they
while increasing slightly in France (and the age men become unemployed, they are had been decreasing during the 1990s
38
United States), see Chart 14. By contrast, more likely to receive unemployment ben - recession ( ). Several changes explain
since 2007, activity rates have continued efits (43 %) than young people (18 %) or this difference.
to increase in many EU countries, even prime-age women (36 %), notably due
those strongly affected by the recession. to their more favourable employment • Older workers have been (in com-
histories. This is one of the factors that parison to the 1990s) less affected
Increase in activity continued promote continuation of job search rather by job losses (see Chart 18) nota-
to be driven by women and older than ‘discouragement’ and inactivity. bly because their educational levels
workers
The increase in the activity rate since Chart 15: Activity rate by group (age and sex), EU-28, 2002–13 (in %)
2008 has mainly been driven by the
rising participation of women and older Men 15-24 Men 25-49 Men 50-64
workers throughout the recession see Women 15-24 Women 25-49 Women 50-64
Chart 15. This is seen to be due to a 100 92.6 92.0
number of factors: structural increases 90
in their activity rate due to cohort 79.7
effects and rising levels of education; 80 75.7 72.1
policy measures designed to encour - 70
age increased female and older workers 64.3 56.9
36
participation( ); and the fact that the 60
initial labour market shock did not hit 50 48.3 44.9
women and older workers as strongly as 43.4
prime-age males. 40 40.9 39.3
30
Chart 17 shows that the decline in activ- 2002 2003 2004 2005 2006 2007 2008 2009 2010 2011 2012 2013
ity rate for prime-age men was lim-
ited (–0.8 pp) compared to the decline in Source: Eurostat, EU-LFS, [lfsi_agan].
Chart 16: Change in the activity rate by group Chart 17: Change in the employment and activity
(age and sex) in EU-28, 2008–13 compared rates by group (age and sex) in EU-28, 2008–13,
to 2002–08, in percentage points in percentage points
8 7.2 8
6.3 6 Changes in ER (pps) Changes in AR (pps) 6.3
6 2002-08 2008-13 4.9
4.5 4 3.3
4 3.3 2
2.6 1.4 0.9
2 1.4 0
0.2 -2 -1.4 -0.8 -1.6
0
-0.6 -0.2 -0.8 -4 -2.8 -3.9
-2 -1.4 -6 -4.8
-2.8 -6.1
-4 -8
Men Women Men Women Men Women Men Women Men Women Men Women
15-24 25-49 50-64 15-24 25-49 50-64
Source: Eurostat, EU-LFS, [lfsa_argan]. Source: Eurostat, EU-LFS, [lfsa_argan] and [lfsa_ergan].
37
( ) In Spain, Portugal and Ireland, decreases
for men were more than offset by increases
for women.
38
36
( ) The increase in older workers participation ( ) For instance: in the UK (–1.6 pps over
over the last decades was also driven by 1990–95), Italy (–4.2 pps over 1991–95)
an overall improvement in their health and Germany (–2.9 pps over 1992–96)
status, see European Commission (2011a), with more pronounced drops for men
Chapter 5. (respectively –5.8 pps, –7.3 pps and 4.9 pps).
50