Page 47 - ePaper
P. 47
Chapter 1: The legacy of the crisis: resilience and challenges
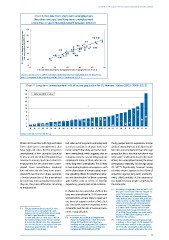
Chart 6: Exit rate from short-term unemployment
(less than one year) and long-term unemployment
(more than 1 year) into employment between 2012/13
60 EE DK
Exit rate from long-term unemployment into employment (2012/2013) 40 RO SK BG IT ES PL PT CY IE LT MT FI HU FR CZ DE LV SI SE UK NL AT
50
30
20
10
0 EL HR
0 10 20 30 40 50 60
Exit rate from short-term unemployment into employment (2012/2013)
Source: Eurostat, EU-LFS, ad-hoc transition calculations based on longitudinal data. No data for BE
and LU. Exceptions to the reference year: NL: 2011/12 instead of 2012/13.
Chart 7: Long-term unemployment in % of active population for EU Member States (2002–2008–2013)
20
18 2002 2008 2013
16
14
12
10
8
6
4
2
0
AT SE FI DK LU DE NL UK MT CZ RO EE BE FR PL HU LT EU-28 SI LV CY IT BG IE PT SK HR ES EL
Source: Eurostat, EU-LFS [une_ltu_a].
While most countries with high exit rates Exit rates out of long-term unemployment Young people tend to experience shorter
from short-term unemployment also seem less sensitive to changes in the eco- spells of unemployment and higher transi-
have high exit rates for the long-term nomic cycle ( 16 ) than they are for the short- tion rates into employment than other age
unemployed, a few countries (such as term unemployed, which suggests that an groups, but this is less true now than it was
17
Germany and the United Kingdom) that economic recovery may not bring back into in the past ( ), with an increase in the share
manage to ensure rapid rates returns to employment many of those who are cur- of long-term unemployed among the young
employment for the short-term unem- rently long-term unemployed. This is likely unemployed, especially for the age group
18
ployed, have nevertheless relatively to have lasting negative consequences, such 25–34 ( ). Significantly, however, having
low exit rates for the long-term unem- as the depreciation of human capital, nega - a tertiary degree appears to be a form of
15
ployed ( ), see Chart 6. In these countries, tive signalling effects for potential employ- protection against long-term unemploy -
a limited proportion of the unemployed ers and demotivation for those concerned, ment, albeit probably at the expense of
become long-term unemployed but when with further risks in terms of benefits less qualified young people competing for
they do, they have difficulties returning dependency, poverty and social exclusion. the same jobs.
to employment. ( ) According to longitudinal data of the EU-LFS
17
It should also be noted that 20 % of the (European Commission (2012a), Chapter 1),
long-term unemployed in 2013 have never even if young people continued to have
better exit rates out of unemployment than
worked before and are likely to need vari- older workers, their situation worsened since
ous forms of support in order to find a first 2008. In 2010-11, they had a much higher
chance of losing their job (8 %) compared
job. This raises concerns regarding access to prime-age (3 %) and older (2 %) workers.
( ) The gap between the exit rates for short to benefits and the risk of social and eco- In addition their transition rate back into
15
versus long-term unemployed is much nomic marginalisation. employment had sharply diminished, from
higher in the UK and Germany (respectively 40 to 30 %. These findings are confirmed by
22 and 19 pps) than the EU average analysis of RWI (2014) drawing on micro-
(11 pps, with rates of 38 % and 27 %). On ( ) For instance, the coefficient of correlation with data from the EU-SILC.
16
18
the contrary Denmark and Estonia manage changes in employment over 2008–10 is much ( ) Strictly speaking the group of young people
to maintain high exit rates into employment stronger for the exit rates out of short-term is defined as those aged 15–24; however for
also for the long-term unemployed and have unemployment into employment (0.92, significant many indicators analysis of the age group
relative low gaps between the two rates at 1 %) than with the exit rates out of long-term 25–34 is also meaningful as this age group
(respectively 8 and 6 pps). unemployment (0.53, significant at 5 %). has also been strongly affected by the crisis.
45