Page 51 - ePaper
P. 51
Chapter 1: The legacy of the crisis: resilience and challenges
strongly in those Member States most labour market conditions, with the worst Due to the combination of life expectancy,
affected by the crisis (Spain, Italy, Ire- hit countries being Spain, Italy, Greece, lower participation in the labour market
land, Malta, United Kingdom). In some the Baltic States, but also the United and household composition (single parent
33
Eastern/Southern countries where dep- Kingdom ( ). Moreover, since many such families), women are at higher risk of
rivation had been improving before the working age adults live in households poverty or social exclusion than men in
crisis, the trend reversed and material with children, child poverty has also risen all Member States, with the exception of
deprivation increased dramatically after across Europe as a whole. In contrast, the Spain and Portugal.
the crisis (Lithuania, Latvia, Estonia, risk-of-poverty indicator for older people
Cyprus, Greece, Hungary and to a lesser showed a significant decline in most 2.2. Participation
extent Bulgaria). Member States between 2008 and 2013 in education and in the labour
reflecting the fact that pensions have, to market continued to rise
Working age adults have been especially a large extent, remain unchanged during
affected, reflecting the deterioration of the crisis. Economic participation, as measured by
the activity rate indicator ( ), has con-
34
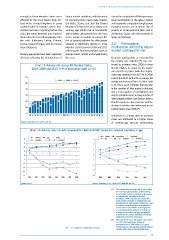
Chart 13: Activity rate across EU Member States, tinued to increase since 2008 in most
2003, 2008 and 2013, in % of population aged 15–64 Member States, in contrast to the experi-
ence in past recessions. While the employ -
ment rate declined from 65.7 % in 2008
85 to 64.1 % in 2013 for the EU as a whole, the
2003 2008 2013 activity rate increased from 70.7 % in 2008
80
to 71.9 % in 2013. It implies that the drop
75 in the number of jobs mainly translated
into a rising number of unemployed and,
70 only to a limited extent, a rising number of
‘discouraged workers’ (see Section below).
65 This EU experience also contrasts with the
decline in activity rate witnessed in the
60
35
United States since 2008 ( ).
55
HR IT RO MT HU PL BE EL BG IE SK LU SI FR EU-28 LT CZ PT CY LV ES EE FI AT UK DE DK NL SE Reductions in activity rates in previous
crises are attributed to a higher share
Source: Eurostat, EU-LFS [lfsi_act_a]. of working-age persons withdrawing
Chart 14: Activity rate (15–64) compared to 1990 and 2007 levels, for selected countries, in pps
Spain Germany Sweden
France US Italy
2 Sweden UK Finland 3 US UK Finland Ireland
1
2
0
1
-1
-2 0
-3 -1
-4
-2
-5
-6 -3
-7 -4
1991 1992 1993 1994 1995 1996 1997 1998 2008 2009 2010 2011 2012 2013
Source: OECD. Source: Eurostat, EU-LFS and OECD data for the US.
34
( ) The activity rate measures the share, among
the working-age population, of those being
economically active, i.e. either in employment
or unemployed, according to the ILO
definitions. While this indicator counts the
total number of people in employment and
unemployment and country-comparisons may
be influenced by differences in institutional
factors (such as incentives to be registered
as unemployed), the analysis of changes of
activity rate over time remains meaningful,
in particular to analyse behavioural changes
compared to previous recessions.
35
( ) Note that for the US, several papers (e.g. Barnes
et al (2013)) show that the decline in
participation since 2008 reflects, to a great
33
( ) See European Commission (2014a). extent, long-term demographic and behavioural
changes rather than cyclical developments.
49
strongly in those Member States most labour market conditions, with the worst Due to the combination of life expectancy,
affected by the crisis (Spain, Italy, Ire- hit countries being Spain, Italy, Greece, lower participation in the labour market
land, Malta, United Kingdom). In some the Baltic States, but also the United and household composition (single parent
33
Eastern/Southern countries where dep- Kingdom ( ). Moreover, since many such families), women are at higher risk of
rivation had been improving before the working age adults live in households poverty or social exclusion than men in
crisis, the trend reversed and material with children, child poverty has also risen all Member States, with the exception of
deprivation increased dramatically after across Europe as a whole. In contrast, the Spain and Portugal.
the crisis (Lithuania, Latvia, Estonia, risk-of-poverty indicator for older people
Cyprus, Greece, Hungary and to a lesser showed a significant decline in most 2.2. Participation
extent Bulgaria). Member States between 2008 and 2013 in education and in the labour
reflecting the fact that pensions have, to market continued to rise
Working age adults have been especially a large extent, remain unchanged during
affected, reflecting the deterioration of the crisis. Economic participation, as measured by
the activity rate indicator ( ), has con-
34
Chart 13: Activity rate across EU Member States, tinued to increase since 2008 in most
2003, 2008 and 2013, in % of population aged 15–64 Member States, in contrast to the experi-
ence in past recessions. While the employ -
ment rate declined from 65.7 % in 2008
85 to 64.1 % in 2013 for the EU as a whole, the
2003 2008 2013 activity rate increased from 70.7 % in 2008
80
to 71.9 % in 2013. It implies that the drop
75 in the number of jobs mainly translated
into a rising number of unemployed and,
70 only to a limited extent, a rising number of
‘discouraged workers’ (see Section below).
65 This EU experience also contrasts with the
decline in activity rate witnessed in the
60
35
United States since 2008 ( ).
55
HR IT RO MT HU PL BE EL BG IE SK LU SI FR EU-28 LT CZ PT CY LV ES EE FI AT UK DE DK NL SE Reductions in activity rates in previous
crises are attributed to a higher share
Source: Eurostat, EU-LFS [lfsi_act_a]. of working-age persons withdrawing
Chart 14: Activity rate (15–64) compared to 1990 and 2007 levels, for selected countries, in pps
Spain Germany Sweden
France US Italy
2 Sweden UK Finland 3 US UK Finland Ireland
1
2
0
1
-1
-2 0
-3 -1
-4
-2
-5
-6 -3
-7 -4
1991 1992 1993 1994 1995 1996 1997 1998 2008 2009 2010 2011 2012 2013
Source: OECD. Source: Eurostat, EU-LFS and OECD data for the US.
34
( ) The activity rate measures the share, among
the working-age population, of those being
economically active, i.e. either in employment
or unemployed, according to the ILO
definitions. While this indicator counts the
total number of people in employment and
unemployment and country-comparisons may
be influenced by differences in institutional
factors (such as incentives to be registered
as unemployed), the analysis of changes of
activity rate over time remains meaningful,
in particular to analyse behavioural changes
compared to previous recessions.
35
( ) Note that for the US, several papers (e.g. Barnes
et al (2013)) show that the decline in
participation since 2008 reflects, to a great
33
( ) See European Commission (2014a). extent, long-term demographic and behavioural
changes rather than cyclical developments.
49