Page 55 - ePaper
P. 55
Chapter 1: The legacy of the crisis: resilience and challenges
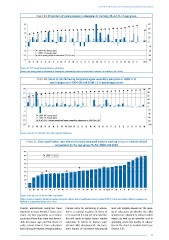
Chart 19: Proportion of young people in education or training, 18–24, % of age group
20 80
15 60
10 40
5 20
0 0
-5 -20
-10 2004-08 change (pps) -40
2008-13 change (pps)
-15 % of young people in education (2013), rhs -60
-20 -80
UK CY MT SE AT RO IT IE BG PT FR HU ES FI LV EL BE KR SK EE CZ LT PL DE NL DK LU SI EU-28
Source: EU-LFS, Social Situation Monitor calculations.
Notes: Only young people in education or training not economically active are measured. Countries are sorted by 2013 levels.
Chart 20: Share of 20-24 having completed upper secondary education in 2008 in %
and changes over 2004-08 and 2008-13 in percentage points
20 100
15 80
60
10
40
5 20
0 0
-5 -20
-40
-10 2004-08 change (pps)
2008-13 change (pps) -60
-15 % of 20-24 having completed upper secondary education in 2008 (rhs, %) -80
-20 -100
PT ES MT DK LU DE NL IT UK RO EU-28 LV EE EL BE HU BG FR AT CY FI SE IE LT SI PL CZ SK HR
Source: Eurostat, EU-LFS [edat_lfse_08]; sorted by 2008 level.
Chart 21: Over-qualification rate: share of tertiary-educated workers working in low or medium-skilled
occupations (in %), age group 25–34, 2008 and 2013
45
40 2008 2013
35
30
25
20
15
10
5
0
LU MT DK DE PT NL FI CZ HU LT SI SE BE AT HR RO LV SK FR EU-28 EE UK IT PL BG EL IE ES CY
Source: Eurostat, EU-LFS and DG EMPL calculations.
Notes: tertiary-educated is defined as workers having the highest level of qualification equal or above ISCED 5–6; low and medium-skilled occupations are
defined as occupational groups ISCO 4 to 9.
Overall, educational outcomes have market entry by remaining in educa- level will notably depend on the qual-
improved in most Member States (see tion is a rational response in times of ity of education, on whether the skills
Chart 20) but especially so in those recession, but it is not yet clear whether acquired are adapted to labour market
countries where they were less favour- this will result in better labour market needs, as well as on whether cuts in
able ten years ago and the share of outcomes in terms of human capi- spending affect the quality of educa-
early school leavers from education tal and skills development. The long- tion in the short to medium term (see
and training decreased. Delaying labour term impact of increased educational Section 4.3).
53