Page 50 - ePaper
P. 50
Employment and Social Developments in Europe 2014
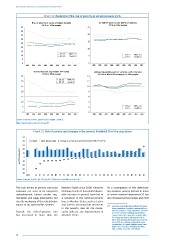
Chart 11: Evolution of the risk of poverty or social exclusion, in %
Risk of poverty or social exclusion (target) At-risk-of-poverty rate (60 % of median)
24 % or 123m people 17 % or 83m people
45 25
40
35 20
30
25 15
20
10
15
EU-27 NMS 12 EU-27 NMS 12
10 EU-15 South 4 5 EU-15 South 4
5
0 0
2005 2006 2007 2008 2009 2010 2011 2012 2013 2005 2006 2007 2008 2009 2010 2011 2012 2013
Severe material deprivation (4+ items) Jobless households (zero or very low work intensity)
10 % or 48m people 10.5 % of the 0-59 acategory or 40m people
35 14
EU-27 NMS 12
30 EU-15 South 4 12
25 10
20 8
15 6
10 4
5 2 EU-27 NMS 12
South 4
EU-15
0 0
2005 2006 2007 2008 2009 2010 2011 2012 2013 2005 2006 2007 2008 2009 2010 2011 2012 2013
Source: Eurostat, EU-SILC (peps01, li02, mddd11, lvhl11).
Note: South4 refers to EL, ES, IT and PT.
Chart 12: Risk of poverty and changes in the poverty threshold, % of the population
50
40 2008 2013 (2012 if NA) Change in at risk of poverty threshold (2008-2012/13)
30
20
% of the population 10 0
-10
-20
-30
-40
EU-27 EL IE* CY LV UK HR* IT PT RO LU NL HU ES LT SI DE EE DK AT FR FI CZ PL BE MT SE BG SK
Source: Eurostat, EU-SILC (ilc_li01,ilc_li02). *Data for IE and HR refers to 2012.
The main drivers of poverty and social Member States since 2008. However, As a consequence of this deteriorat-
exclusion are seen to be long-term declining levels of household dispos- ing situation, poverty defined in terms
-
32
unemployment, labour market seg able incomes in general have led to of severe material deprivation ( ) has
mentation and wage polarisation, but a reduction in the national poverty also increased across Europe, and most
also the weakening of the redistributive lines in Member States such as Latvia
impact of tax and benefits systems. and Greece, meaning that decreases 32
( ) Severely materially deprived persons have
in the poverty rate do not neces- living conditions severely constrained by a
Overall, the risk-of-poverty rate sarily indicate any improvement in lack of resources. They experience at least
4 out of 9 of the following deprivations:
absolute terms.
has increased in more than ten cannot afford i) to pay rent or utility bills,
ii) to keep the home adequately warm,
iii) to face unexpected expenses, iv) to eat
meat, fish or a protein equivalent every
second day, v) a week holiday away from
home, vi) a car, vii) a washing machine,
viii) a colour TV, or ix) a telephone.
48