Page 48 - ePaper
P. 48
Employment and Social Developments in Europe 2014
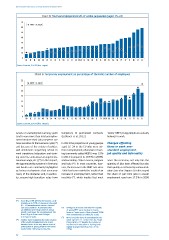
Chart 8: Youth unemployment in % of active population (aged 15–24)
70
2008 2013
60
50
40
30
20
10
0
DE AT NL DK MT LU EE CZ FI UK SI LT LV EU-28 SE RO BE FR IE HU PL BG SK PT CY IT HR ES EL
Source: Eurostat, EU-LFS [lfsa_urgan].
Chart 9: Temporary employment as percentage of the total number of employees
35
2007 2013
30
25
20
15
10
5
0
RO EE LT LV MT SK BG UK LU HU IE CZ BE AT DK EL HR IT CY EU-28 DE FR FI SE NL SI PT PL ES
Source: Eurostat, EU-LFS [lfsa_etpgan].
Levels of unemployment among youth temporary to permanent contracts ‘newly’ NEET young people are actually
tend to vary more than total unemploy- (Eichhorst et al, 2012). looking for work.
ment because their job prospects are
19
more sensitive to the business cycle ( ) In 2013 the proportion of young people Changes affecting
and because of the variety of policies aged 15–24 in the EU who were nei- those in work: non-
and institutions supporting school to ther in employment, education or train- standard employment,
work transitions (education and train- ing (commonly called NEETs) was 13 % job quality and informality
ing systems, contractual arrangements, in 2013 (compared to 10.8 % in 2008),
minimum wage, etc.) ( ). In this respect, and exceeding 20 % in Greece, Bulgaria Since the recession, not only has the
20
21
the apprenticeship systems in Germany and Italy ( ). In most countries, how- quantity of jobs been affected but also
and Austria are commonly highlighted ever, the increase in the NEET rate since their quality as reflected by various indi -
as being mechanisms that overcome 2008 has been mainly the result of an cators (see also Chapter 3). In this regard
many of the obstacles and, in particu- increase in unemployment, rather than the share of part-time jobs in overall
lar, ensure high transition rates from inactivity ( ), which implies that most employment rose from 17.5 % in 2008
22
19
( ) According to IMF (2014), the business cycle
‘explains up to 70 % of changes in the youth
(15–24) unemployment rates in stressed
21
euro area countries’. It estimates that ( ) In Bulgaria, Romania and Italy the majority
an additional percentage point of annual of young NEET were inactive, in Greece,
growth could lower the unemployment rate Spain or Croatia most of them (around 70 %)
from 0.8 pp in Greece and Portugal were unemployed (i.e. looking for a job).
to 1.9 pps in Spain. ( ) At EU level, the share of unemployed in the
22
20
( ) Another factor explaining the wide variation whole age class 15–24 has risen by 2.6 pps
of the youth unemployment rate across (from 6.6 % to 9.2 %) while the number of
Member States is the very diverse level of inactive (not in education or training) only
participation of young people in the labour slightly changed (by 0.3 pp, from 7.4 to
market while still being in education. 7.7 %).
46