Page 46 - ePaper
P. 46
Employment and Social Developments in Europe 2014
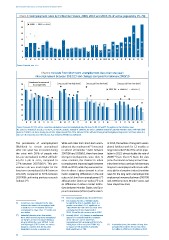
Chart 4: Unemployment rates by EU Member States, 2008, 2010 and 2013 (% of active population, 15–74)
30
2008 2010 2013
25
20
15
10
5
0
EE LV LT DE HU IE SE DK MT SK CZ UK FI RO BE AT PL FR LU EU-28 NL BG SI IT PT HR ES CY EL
Source: Eurostat, une_rt_a.
Chart 5: Exit rate from short-term unemployment (less than one year)
into employment between 2012/13 and changes compared to between 2009/10
Maintained or increased
70 from high levels Decreased from high level Increased from low level Decreased from low level
60 2007-08 2009-10 2012-13
50
40
30
20
10
0
AT EE UK DE SI SE FI DK NL CZ FR CY LV HU MT LT IE BG PL IT ES SK HR RO EL
Source: Eurostat, EU-LFS, ad-hoc transition calculations based on longitudinal data. No data for BE, LU and PT. Exceptions to the reference year:
NL: 2011/12 instead of 2012/13; AT, HR, PL, SI and UK: 2010/11 instead of 2009/10; DE and LT: 2008/09 instead of 2007/08. Member States with high (low)
levels in 2009/10 are those having an exit rate higher (lower) than 39 %. Member States with decreasing (maintaining/increasing) levels are those where the
exit rate decreased by more (less) than 1.5 pp between 2009/10 and 2012/13.
The persistence of unemployment While exit rates from short-term unem- In 2013, the number of long-term unem-
11
(likelihood to remain unemployed ployment into employment ( ) worsened ployed (without work for 12 months or
after one year) has increased during in almost all Member States between longer) exceeded 5 % of the active popu-
the crisis with 38 % of people who 2007/08 and 2009/10, there have been lation in 2013, almost double the rate of
became unemployed in 2012 still look- divergent developments since then. In 2008 ( ) (see Chart 7). Given the slow
14
ing for a job in 2013, compared to some countries, the chances to return pace of economic recovery in most coun-
27 % between 2007/08 ( ). This per- to employment improved again between tries, there is thus a serious risk that many
9
sistence rate was much higher for the 2010 and 2013, while they worsened fur - long-term unemployed will remain with-
long-term unemployed (63 % between ther in others. Labour demand is a key out a job for a long time. Indeed, transition
2012/13, compared to 50 % between factor explaining differences in the exit rates for the long-term unemployed into
12
2007/08) confirming previous research rates out of short-term unemployment ( ) employment worsened between 2007/08
findings ( ). although other factors are at play ( ) such and 2009/10 in most Member States, and
10
13
as differences in labour market institu- have stayed low since.
tions between Member States, see Euro-
pean Commission (2012a) and Section 5.
( ) Based on longitudinal data from the EU-LFS.
11
12
( ) For instance, for the 22 Member States
( ) Persistence rate estimated as the ratio for which the data is available, there is a
9
between the number of unemployed with positive correlation (+0.59, significant at
a duration of 12–24 months and those 1 %) between the exit rate from short-term
unemployed for fewer than 12 months one unemployment (into employment) in
year before. 2012-13 and the job vacancy rate in 2012.
( ) Individual characteristics also matter: ( ) Recently (2010–13), changes in employment
10
13
those who become long-term unemployed appear less correlated with the variations
are likely to be those for whom finding a of the exit rates out of short-term
job was initially the most difficult. Cockx unemployment into employment than in the
and Dejemeppe (2012) shows for various initial phase of the recession (2008–10), ( ) In absolute terms, the number of long-term
14
European countries that the duration i.e. equal to 0.70 and 0.92 respectively unemployed in the EU-28 increased from
dependence may be a spurious one. (both significant at 1 %). 6.2 million in 2008 to 12.3 million in 2013.
44