Page 44 - ePaper
P. 44
Employment and Social Developments in Europe 2014
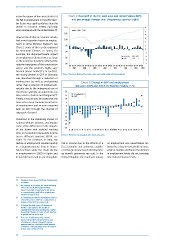
In the first phase of the crisis (2008–10) Chart 1: Real GDP in the EU, euro area and United States (left),
the fall in employment in most EU Mem- and percentage changes over the previous quarter (right)
ber States was significantly less than the
decline in economic activity especially 110 6
4
when compared with the United States ( ). Index 2007=100 5
105 4
However the decline in economic activity 3
had a much greater impact on employ- 100 2
5
ment in some Member States ( ) see 95 1
Chart 2. Some of this can be explained 0
by structural factors. In Spain, for 90
example, the disproportionate impact -1
on employment (almost twice as large 85 EU-28 EU-28 -2
US
US
as the economic shock) ( ), reflected the -3
6
relative importance of the construction 80 Q1 Q2 Q3 Q4 Q1 Q2 Q3 Q4 Q1 Q2 Q3 Q4 Q1 Q2 Q3 Q4 Q1 Q2 Q3 Q4 Q1 Q2 Q3 Q4 Q1 Q2 Q3 Q4 Q1 -4
sector and the country’s highly seg- 2007 2008 2009 2010 2011 2012 2013 2014
7
mented labour market ( ). In contrast,
the strong decline in GDP in Germany Source: Eurostat, National Accounts, data seasonally adjusted [namq_gdp_k].
was absorbed through a reduction of
working time (as well as productivity) Chart 2: Change in GDP and employment
rather than a reduction of employment, between 2008 and 2013, EU Member States, in %
notably due to the widespread use of
short-time working arrangements (as 20
8
also used in Austria and Belgium) ( ). 15 Employment
GDP
Finally, it should also be noted that the 10
more or less large transmission in terms 5
of employment and income impacted 0
later on GDP through the channel of -5
aggregate demand. -10
-15
Variations in the stabilising impact of -20
national welfare systems also explain -25
some of the differences in the impacts -30
of job losses and reduced working EL HR SI CY IT PT ES LV IE FI HU NL DK CZ BG LT RO EU-28 UK FR EE LU BE AT DE SK MT SE PL
time on household disposable income Source: Eurostat, nama_gdp_k and nama_aux_pem.
across different countries (GDHI, see
Chart 3). For instance, in Italy, the
decline in employment resulted quickly fall in income due to the effects of a on employment was nevertheless fol-
in a disproportionate drop in house- fiscal stimulus and automatic stabilis- lowed by a drop in household incomes,
hold incomes while the sharp decline ers (though income levels did drop later while in Sweden and France the declines
in employment in 2009 in Spain and as benefit payments ran out). In the in employment levels did not translate
Ireland did not result in any immediate United Kingdom, the moderate impact into reduced income levels.
( ) European Commission (2010a), Employment
4
in Europe.
5
( ) By contrast, in Germany the manufacturing
sector was badly hit by plummeting
exports but high productivity levels led to
a comparatively small fall in employment
relative to that in GDP.
6
( ) i.e. employment volume declining by almost
7 % in the year to 2009 Q3, compared to a
decline of the GDP by around 4 %.
( ) In Poland the high share of temporary
7
workers also explains the decline in
employment that occurred despite a rather
favourable change in terms of GDP (decline
in growth but no recession).
( ) The cost of adjustment was spread
8
across the workforce instead of, in case
of extensive reliance on layoffs, being
concentrated on a relatively small number
of workers suffering large losses of income
(Cahuc and Carcillo (2011)).
42