Page 59 - ePaper
P. 59
Chapter 1: The legacy of the crisis: resilience and challenges
The role of tax and transfers Changes in the impact of social transfers especially the case in Sweden, Hungary,
in mitigating inequalities on reducing poverty may be due to policy Germany, Denmark, Belgium and France
increased in most countries changes or to changes in the composi- (Chart 28). In some other Member States,
tion of the population at risk of poverty such as the United Kingdom Spain and
(e.g. an increased share of unemployed
Overall, while social spending had Ireland, social transfers contributed to
played a significant role in sustaining or working poor). In some Member States smoothing the impact of the crisis on
household incomes in most countries in which had previously had high levels of poverty. Lastly, in some Member States,
2008/2009, this contribution lessened social transfers, the impact of social the impact of transfers on reducing pov -
from 2010 onwards ( ). Nevertheless, transfers on poverty reduction decreased erty has lowered significantly, as in the
56
the redistributive role of tax and trans- significantly during the recession. This is Czech Republic and Poland.
fer systems helped limit the increase
in market income inequality (see
Chart 27), as expected when a large Chart 27: Changes in market income and disposable
number of workers lose their jobs. In a income inequalities (2008–12), Gini index
few countries, however, market income
inequality declined while after-tax and 0.09
transfers inequality increased. 0.08 Redistribution Redistribution
0.07 increased declined
0.06
A Euromod micro-simulation study of 0.05
13 EU countries found that the policy 0.04
changes undertaken between 2008 and pp change (2008-2012) 0.03
0.02
2013 resulted in a reduction of income 0.01
in aggregate terms which directly con- 0
tributed to increased hardship especially -0.01 Change in market income inequality
-0.02
among low income households, whose -0.03 Change in disposable income inequality
budgets were already very constrained -0.04
(De Agostini et al., 2014). Neverthe- -0.05 PT BE NL FI DK IE CZ LU EL UK SI IT DK EE AT FR ES PL SE SK
less the distributional effects of these
changes have been broadly progressive, Source: OECD, income sources database.
with some country exceptions, despite Note: Year refers to SILC production year and not reference year. 2008 data not available for SE, DE, IT,
increases in VAT rates which are normally FR, IT. 2012 data not available for BE. No data for Hungary.
judged to be regressive.
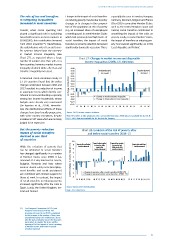
But the poverty reduction Chart 28: Evolution of the risk of poverty after
impact of social transfers and before social transfers 2008–13
declined in one third
of countries 10 Poverty before transfers Poverty before transfers
decreased or kept
While the reduction of poverty that 8 Poverty after and before increased or stable, stable, poverty after Poverty after and before
transfers decreased
transfers increased
poverty after
can be attributed to social transfers 6 transfers decreased transfers increased
has changed significantly in a number 4
of Member States since 2008, it has 2
remained at a very low level in Greece, 2008-13 change in poverty rates (points) 0
Bulgaria, Romania and Italy where -2
weak or absent safety nets (unemploy- -4
ment benefits and social assistance) Change in poverty after social transfers (2008-13)
are combined with limited support for -6 Change in poverty before social transfers (2008-13)
those at work. In contrast, the impact -8
of social transfers in reducing poverty LV FI RO AT CZ BG UK EE CY ES NL BE MT PL DK DE HU SE PT IE IT LT FR SK SI LU EL
increased significantly after the crisis in
Spain, Latvia, the United Kingdom, Ire- Source: Eurostat EU-SILC (ilc_li02).
land and Finland. Note: 2012 data for IE.
56
( ) See European Commission (2013c) and
European Commission (2014a). The
lessening observed from 2010 is explained
by the increase in the number of long-term
unemployed losing their entitlements along
with the partial phasing-out of the measures
put in place to counter the crisis and the
tapering off of the impact of social spending
in Member States where the economic
situation improved.
57
The role of tax and transfers Changes in the impact of social transfers especially the case in Sweden, Hungary,
in mitigating inequalities on reducing poverty may be due to policy Germany, Denmark, Belgium and France
increased in most countries changes or to changes in the composi- (Chart 28). In some other Member States,
tion of the population at risk of poverty such as the United Kingdom Spain and
(e.g. an increased share of unemployed
Overall, while social spending had Ireland, social transfers contributed to
played a significant role in sustaining or working poor). In some Member States smoothing the impact of the crisis on
household incomes in most countries in which had previously had high levels of poverty. Lastly, in some Member States,
2008/2009, this contribution lessened social transfers, the impact of social the impact of transfers on reducing pov -
from 2010 onwards ( ). Nevertheless, transfers on poverty reduction decreased erty has lowered significantly, as in the
56
the redistributive role of tax and trans- significantly during the recession. This is Czech Republic and Poland.
fer systems helped limit the increase
in market income inequality (see
Chart 27), as expected when a large Chart 27: Changes in market income and disposable
number of workers lose their jobs. In a income inequalities (2008–12), Gini index
few countries, however, market income
inequality declined while after-tax and 0.09
transfers inequality increased. 0.08 Redistribution Redistribution
0.07 increased declined
0.06
A Euromod micro-simulation study of 0.05
13 EU countries found that the policy 0.04
changes undertaken between 2008 and pp change (2008-2012) 0.03
0.02
2013 resulted in a reduction of income 0.01
in aggregate terms which directly con- 0
tributed to increased hardship especially -0.01 Change in market income inequality
-0.02
among low income households, whose -0.03 Change in disposable income inequality
budgets were already very constrained -0.04
(De Agostini et al., 2014). Neverthe- -0.05 PT BE NL FI DK IE CZ LU EL UK SI IT DK EE AT FR ES PL SE SK
less the distributional effects of these
changes have been broadly progressive, Source: OECD, income sources database.
with some country exceptions, despite Note: Year refers to SILC production year and not reference year. 2008 data not available for SE, DE, IT,
increases in VAT rates which are normally FR, IT. 2012 data not available for BE. No data for Hungary.
judged to be regressive.
But the poverty reduction Chart 28: Evolution of the risk of poverty after
impact of social transfers and before social transfers 2008–13
declined in one third
of countries 10 Poverty before transfers Poverty before transfers
decreased or kept
While the reduction of poverty that 8 Poverty after and before increased or stable, stable, poverty after Poverty after and before
transfers decreased
transfers increased
poverty after
can be attributed to social transfers 6 transfers decreased transfers increased
has changed significantly in a number 4
of Member States since 2008, it has 2
remained at a very low level in Greece, 2008-13 change in poverty rates (points) 0
Bulgaria, Romania and Italy where -2
weak or absent safety nets (unemploy- -4
ment benefits and social assistance) Change in poverty after social transfers (2008-13)
are combined with limited support for -6 Change in poverty before social transfers (2008-13)
those at work. In contrast, the impact -8
of social transfers in reducing poverty LV FI RO AT CZ BG UK EE CY ES NL BE MT PL DK DE HU SE PT IE IT LT FR SK SI LU EL
increased significantly after the crisis in
Spain, Latvia, the United Kingdom, Ire- Source: Eurostat EU-SILC (ilc_li02).
land and Finland. Note: 2012 data for IE.
56
( ) See European Commission (2013c) and
European Commission (2014a). The
lessening observed from 2010 is explained
by the increase in the number of long-term
unemployed losing their entitlements along
with the partial phasing-out of the measures
put in place to counter the crisis and the
tapering off of the impact of social spending
in Member States where the economic
situation improved.
57