Page 62 - ePaper
P. 62
Employment and Social Developments in Europe 2014
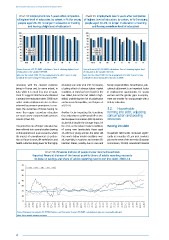
Chart 32: Employment rate 5 years after completion Chart 33: Employment rate 5 years after completion
of highest level of education, by cohort, in % (for young of highest level of education, by cohort, in % (for young
people aged 20–29, no longer in education or training people aged 20–29, no longer in education or training
and having a high level of education) and having a medium level of education)
100 100
90 90
80 80
70 70
60 60
% 50 % 50
40 2002-03 40 2002-03
2004-05
2004-05
30 2006-07 30 2006-07
20 2008-09 20 2008-09
10 10
0 0
EU-28 DE UK SE LT FR IT ES EU-28 DE UK SE LT FR IT ES
Source: Eurostat, LFS, DG EMPL calculations. Year of obtaining highest level Source: Eurostat, LFS, DG EMPL calculations. Year of obtaining highest level
of education is the variable HATYEAR. of education is the variable HATYEAR.
Note: For the cohort 2008–09, the employment rate after 5 years is only Note: For the cohort 2008–09, the employment rate after 5 years is only
available for those having left education in 2008. available for those having left education in 2008.
recession, with the clearest evidence educated, see Cutler et al (2014). Likewise, family responsibilities. Nevertheless, edu -
being in France and, to some extent, in a lasting effect of adverse labour market cational attainment is an important factor
Italy, while it is much less true in Spain. conditions at entry has been found for the in employment opportunities for young
Chart 32 suggests that those who obtained low-skilled, but not the mid-skilled or high- women and the gender gaps in employ -
a tertiary level education after 2008 have skilled, underlining the risk of polarisation ment are smaller for young people with a
rather similar employment rates to those and increased inequalities, see Burgess et tertiary education.
achieved by previous generations. In con- al (2013).
trast, the outcomes of those having no 3.2. Households:
more than upper secondary education Another factor impacting the transitions running into debt, adjusting
are much worse compared with previous from education to professional life is gen- consumption and pooling
cohorts (Chart 33). der. European Commission (2013i) demon- resources
strated that despite the stronger impact of
This protective role of higher education has the crisis on the labour market conditions Running into debt
been referred to in several studies drawing of young men (particularly those aged
on the experience of past recessions, where 15–24) than young women, the latter still Household debt levels increased signifi -
the impact of unemployment at gradua - face worse labour market conditions over- cantly in a number of Euro area countries
tion on future income, life satisfaction and all, especially in southern and eastern EU prior to the onset of the recession (European
health outcomes being lower for the highly Member States, notably due to care and Commission, 2014d). Household financial
Chart 34: Financial distress of people in low-income households
Reported financial distress of the lowest quartile (share of adults reporting necessity
to draw on savings and share of adults reporting need to run into debt), 2000–14
70
EU PT DE ES EL
60
50
40
%
30
20
10
0
2006M2 2006M5 2006M8 2006M11 2007M2 2007M5 2007M8 2007M11 2008M2 2008M5 2008M8 2008M11 2009M2 2009M5 2009M8 2009M11 2010M2 2010M5 2010M8 2010M11 2011M2 2011M5 2011M8 2011M11 2012M2 2012M5 2012M8 2012M11 2013M2 2013M5 2013M8 2013M11 2014M2
Source: European Commission DG ECFIN, Business and Consumer Surveys (DG EMPL calculations), data non-seasonally adjusted.
Note: Three-month moving averages.
60