Page 67 - ePaper
P. 67
Chapter 1: The legacy of the crisis: resilience and challenges
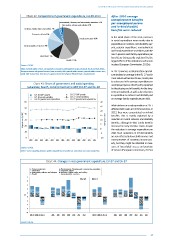
Chart 42: Composition of government expenditure, EU-28 2012 After 2010 average
unemployment benefits
Environment, Housing and community amenities 3 % per unemployed person
Recreation, culture and religion 2 % and in-kind (health)
Defence, Public order and safety 7 %
benefits were reduced
Economic affairs 8 %
In the initial phase of the crisis, increases
Social protection 40 %
in social expenditure were mostly due to
expenditure on sickness and disability sup-
General public services 14 %
port, pension expenditure, unemployment
and family expenditure on children, with the
rise in pension and family expenditure per
Education 11 % beneficiary being partly explained by the
Health 15 % lagged effects of the indexation mechanism
Source: COFOG. in place (European Commission, 2013a).
Notes: General public services corresponds to executive and legislative organs, financial, fiscal, external affairs,
foreign economic aid, general services, basic research, R&D general public services, general public services n.e.c., In 2011, however, social protection expendi -
public debt transactions, transfers of a general character between different levels of government. ture declined on average in the EU-27 and in
most individual Member States, mostly due
to a decrease in the average expenditure per
Chart 43: Share of government and social spending unemployed person (itself partly explained
(education, health, social protection) in GDP, EU-27 and EA-18 by the phasing-out of benefits for the long-
term unemployed), as well as by reductions
EA-18 GDP growth EU-27 GDP growth in expenditure on sickness and disability and
EA-18 social spending EU-27 social spending
EA-18 government expenditure EU-27 government expenditure on average family expenditure per child.
60 30
25 While declines in social expenditure in 2011
50 affected both cash and in-kind services, in
20 2012 they were concentrated on in-kind
Expenditure (% GDP) 30 15 GDP growth (%) benefits. This is mainly explained by a
40
reduction in in-kind sickness and disability
10
benefits, although in-kind family benefits
20
0 5 increased in many Member States despite
the reduction in average expenditure per
10
-5 child. Such reductions in in-kind benefits
are not reflected in household incomes and
0 -10
2000 2001 2002 2003 2004 2005 2006 2007 2008 2009 2010 2011 2012 measurements of monetary income pov -
erty, but they might be reflected in mea -
Source: COFOG. sures of households’ access and provision
Notes: Social spending includes public expenditure in healthcare, education and social protection. of services (European Commission, 2013a).
Chart 44: Changes in real government expenditure, EU-27 and EA-17
Social protection Environment, Housing and community amenities
Education Economic affairs
Recreation, culture and religion Defence, Public order and safety
Health General public services
5
EU-27 EA-17
4
3
2
1
%
0
-1
-2
-3
-4
2001-07 2008-10 2011-12 2006 2007 2008 2009 2010 2011 2012 2001-07 2008-10 2011-12 2006 2007 2008 2009 2010 2011 2012
Source: COFOG.
65