Page 72 - ePaper
P. 72
Employment and Social Developments in Europe 2014
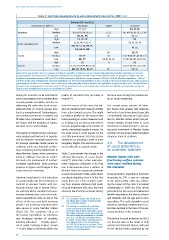
Table 2: Summary developments in social investment (real terms, 2007–11)
Between 2007 and 2011
Investments in 2007 in … Decreased Stable Increased
High PT, SI, IT DK, FI, SE
Education Medium IE, HU, LV, UK, EE, ES LT, CZ BE, MT, NL, AT, PL, CY, FR
Low BG, EL, RO SK DE, LU
High DK, HU, UK SE
Medium EL, IE, FR, FI, ES, IT DE, AT, SK, LV
Active unemployment
Low RO, CY, LT, CZ, PT, PL, MT, EE
LU, BE, SI, BG
High DK SE, FI
Family Medium RO, PT SI ES, FR UK, DE, AT, NL, LU
Low EL, CY EE, IE, PL, SK IT, HU, BE, MT, LV, LT, BG
High DK FI SE
Overall Medium EL, ES, HU, IT, PT, RO, SI, UK AT, BE, DE, FR, LU, LV, NL
Low BG, CZ, LT, PL, IE, CY EE MT, SK
Notes: In the rows Member States are grouped according to expenditure in child day care per relevant child population, education expenditure per relevant
young population and mostly active unemployment expenditure per unemployed in 2007. In the columns Member States are grouped according to the real
evolution of expenditure between 2007 and 2011. Stable real growth is defined for changes between 1.5 % and –1.5 % for education expenditure, –4 % and
+4 % for mostly active unemployment and family expenditure. The level of overall expenditure in 2007 is based on the social investment score, which assign an
equal weight to the three areas. Member States can be in the ‘high’ group only if they do not have ‘low’ expenditure in any of the three areas. The overall trend
is based on the average growth in the three areas. For NL the social investment score is based only on education and child day care expenditure as data for
mostly active unemployment measures are not reliable in ESSPROS.
During the recession social investments quality of education they are likely to but most were coming from medium lev -
were concentrated more on children than receive ( ). els of social investment.
81
on young people and adults, and also on
addressing life-cycle risks (such as par- Over the course of the crisis, the bal- The second group consists of Mem-
enthood) than on income groups risks ance of unemployment measures shifted ber States that already had relatively
(such as unemployment). Continuing pre- from active towards passive. This might low levels of social investment (especially
vious trends, investments in children and possibly be justified on the grounds that Czech Republic, Romania and Cyprus), but
families have increased in most Mem- total spending on active measures such also by Member States which had pre-
ber States, with the exception of Cyprus, as training may not necessarily need to viously medium to high levels of social
Romania, Greece and Portugal. increase proportionally as the number of investment. As shown in Chart 51, increas -
newly unemployed people increase. On ing social investment in Member States
The majority of Member States with previ - the other hand, it could equally be the starting from low levels yields the highest
ously medium and low levels of expendi- case that governments felt that, as they returns in terms of resilience.
ture for childcare converged towards the needed to cut spending in order to meet
EU average, especially Malta (where an budgetary targets, this was the easier or 4.4. The development
ambitious reform was initiated) and Aus- more politically acceptable option. of social protection as
tria, Luxembourg and the Netherlands. In an automatic stabiliser
these Member States, which continue to Table 2 summarises the change in the
invest in childcare from low to moder- selected dimensions of social invest- Member States with well-
ate levels, the employment of mothers ment ( ) (education, active unemploy- functioning welfare systems
82
increased significantly, while previous ment measures, childcare) in its final were more resilient during
progress in Cyprus and Portugal in this row. It demonstrates that a number of the recession
respect has been reversing. Member States are progressing towards
a social investment model, while others Social protection expenditure had been
Likewise, investment in the education are clearly departing from it. In the first increasing by 2 % a year on average
of young people has been reducing, in group there are a few countries start- in the period 2001–2005 but, follow -
contrast to previous trends, with par- ing from already relatively high levels ing the impact of the crisis it increased
ticularly serious cuts in Greece, Roma- of social investment (SE) and a few from considerably in 2009 (by 6 %), driven
nia and Italy where starting levels were relatively low levels (in particular Malta), particularly by increased unemployment
already relatively low. Such cuts in edu- benefits expenditure, but also by sickness
cation expenditure come on top of the ( ) This conclusion needs to be refined as we and disability and old age and survivor
81
effects of the recession itself on young are talking about a share of young people, expenditure. This cyclical growth in social
not an absolute number.
people. Cuts in tertiary education were ( ) The inclusion of investments in education protection spending continued until 2011,
82
also severe in some Member States in the assessment of the level of social but then declined in the face of the per-
(Chart 52). The combined effect of investment (low, medium, high) often change sistent weakness in the economy.
the ranking of Member States with respect to
decreasing expenditure on education the case in which this expenditure is excluded.
and increased number of students In EL, IE, IT, LU, RO and, especially, in AT, DE, The decline in social protection by 2012
ES and NL the inclusion of education worsen
entering education — notably appar- the ranking in terms of social investment. can thus be seen as the result of both
ent in Spain, Portugal, Ireland, Estonia In CY, EE, HU, LV, UK and, in particular, PT the cyclical and structural factors, with part
inclusion of education improves their ranking
— is also liable to adversely affect the in terms of social investment. of the decline being explained by the
70