Page 71 - ePaper
P. 71
Chapter 1: The legacy of the crisis: resilience and challenges
While total EU unemployment expenditure Chart 51: Correlation between social investment (excluding education)
had been falling prior to the recession as and resilience (pp change in LTU / pp change in GDP)
labour market conditions improved, devel-
opments since have been affected by 1 DK
divergent forces — increases in the aver- 0.9
age level of unemployment expenditure 0.8
per unemployed person, on the one hand, 0.7
off-set by reductions in the number of short 0.6
and, especially, long-term unemployed. Social investment score (excl. education) 2007 0.5 HU SE FI
In the first phase of the crisis — from 0.4 UK NL
0.3
2008 to 2009 — unemployment expendi - 0.2 EL SI FR RO DE
ture across the EU increased, mostly due 0.1 ES PT IE LT LV AT LU
to the increased number of unemployed 0 SK CY BG EE BE CZ IT MT
(European Commission, 2013a), although -1 -0.8 -0.6 -0.4 -0.2 0 0.2
it actually fell in Germany as the number Weaker....... Resilience (pp change LTU/GDP growth)...... Stronger
of unemployed decreased, but also in
Poland — but in the latter case due to Notes: The social investment score is based on 2007 values of child day care and mostly active
unemployment expenditure per unemployed, where both areas are assigned equal weight. Resilience
a reduction in the average unemploy- is measured by the ratio between the pp change in LTU in 2009–2010 and GDP growth in 2008–2009.
ment expenditure per unemployed person PL is not reported in the Chart as it did not have a negative economic shock in this period. For NL the
(European Commission, 2013a). social investment score is based only on education and child day care expenditure as data for mostly
active unemployment measures are not reliable in ESSPROS.
During the crisis, however, most
Member States reduced real unemploy - Chart 52: Real growth of social expenditure
ment spending per unemployed person on for tertiary education, 2007–12
measures that were primarily active, this
being notably the case of Lithuania, Roma- 120
nia and Cyprus, where such spending was Tertiary
already low, and in Hungary. This declining All levels
trend is particularly problematic in coun - 80
tries such as Cyprus, Hungary and Bulgaria 60
where the activation component within the Real growth, 2007-2012, % 100
standard unemployment benefits system 40
80
was already very limited ( ). 20
In most other Member States, unemploy- -20 0
ment benefit payments increased pro-
portionally more than spending on active -40 HU RO IT UK PT EL CZ LV PL AT BG CY ES* IE SI FI NL DE SE LT EE DK MT FR LU
measures as unemployment rose and
labour demand fell, although expenditure Sources: COFOG.
on mostly active unemployment measures Notes: 2011 for ES.
did increase in some Member States which
had previously invested comparatively less
in these types of measures (Estonia and social investment may improve resilience, young population in 2007. The overall score
particularly Malta) as well as in Sweden, it is also subject to decreasing returns with, of social investment is measured by assign -
Germany, Austria, Slovakia and Latvia. for example, the high level of social invest - ing equal weights to the three areas and the
ment in Denmark seen to be doing more to growth over 2007–2011 corresponds to the
Some countries are evolving ensure initial low levels of LTU than to con - average growth in the three areas.
towards a social investment tain the effects of economic shocks on LTU.
model, while others Member States that started with low lev-
are departing from it Table 2 summarises the development in els of social investment and whose invest -
real terms of social investment in specific ments were subsequently reduced further
Some of the Member States with relatively areas (education, unemployment, family) (Low/Decreased in the Table 2) represent a
high levels of social investment appear to across Member States since the recession. particular concern. Member States starting
have maintained the resilience of their sys - This assessment of the evolution towards a from low levels, but where social invest-
tems during the recession, as measured social investment model takes into account ments increased, are promising as it seems
in terms of levels of LTU and GDP — this the orientation of welfare systems before that they can expect the highest returns.
being particularly noticeable in the case the recession, with Member States divided In some Member States, social investment
in Germany, which managed to decrease into three groups (low/medium/high), based increased in some areas, while not in oth-
LTU. However Chart 51 suggests that, while on the level of investment in child day care ers. For instance, in Poland investment in
per relevant child population, mostly active education increased, while it decreased in
unemployment expenditure per unemployed child day care and active unemployment
80
( ) Based on Venn (2012) scoring of job-search,
monitoring and job sanctions. and education expenditure per relevant measures in real terms.
69
While total EU unemployment expenditure Chart 51: Correlation between social investment (excluding education)
had been falling prior to the recession as and resilience (pp change in LTU / pp change in GDP)
labour market conditions improved, devel-
opments since have been affected by 1 DK
divergent forces — increases in the aver- 0.9
age level of unemployment expenditure 0.8
per unemployed person, on the one hand, 0.7
off-set by reductions in the number of short 0.6
and, especially, long-term unemployed. Social investment score (excl. education) 2007 0.5 HU SE FI
In the first phase of the crisis — from 0.4 UK NL
0.3
2008 to 2009 — unemployment expendi - 0.2 EL SI FR RO DE
ture across the EU increased, mostly due 0.1 ES PT IE LT LV AT LU
to the increased number of unemployed 0 SK CY BG EE BE CZ IT MT
(European Commission, 2013a), although -1 -0.8 -0.6 -0.4 -0.2 0 0.2
it actually fell in Germany as the number Weaker....... Resilience (pp change LTU/GDP growth)...... Stronger
of unemployed decreased, but also in
Poland — but in the latter case due to Notes: The social investment score is based on 2007 values of child day care and mostly active
unemployment expenditure per unemployed, where both areas are assigned equal weight. Resilience
a reduction in the average unemploy- is measured by the ratio between the pp change in LTU in 2009–2010 and GDP growth in 2008–2009.
ment expenditure per unemployed person PL is not reported in the Chart as it did not have a negative economic shock in this period. For NL the
(European Commission, 2013a). social investment score is based only on education and child day care expenditure as data for mostly
active unemployment measures are not reliable in ESSPROS.
During the crisis, however, most
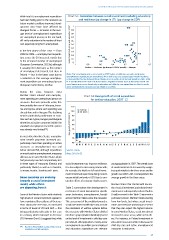
Member States reduced real unemploy - Chart 52: Real growth of social expenditure
ment spending per unemployed person on for tertiary education, 2007–12
measures that were primarily active, this
being notably the case of Lithuania, Roma- 120
nia and Cyprus, where such spending was Tertiary
already low, and in Hungary. This declining All levels
trend is particularly problematic in coun - 80
tries such as Cyprus, Hungary and Bulgaria 60
where the activation component within the Real growth, 2007-2012, % 100
standard unemployment benefits system 40
80
was already very limited ( ). 20
In most other Member States, unemploy- -20 0
ment benefit payments increased pro-
portionally more than spending on active -40 HU RO IT UK PT EL CZ LV PL AT BG CY ES* IE SI FI NL DE SE LT EE DK MT FR LU
measures as unemployment rose and
labour demand fell, although expenditure Sources: COFOG.
on mostly active unemployment measures Notes: 2011 for ES.
did increase in some Member States which
had previously invested comparatively less
in these types of measures (Estonia and social investment may improve resilience, young population in 2007. The overall score
particularly Malta) as well as in Sweden, it is also subject to decreasing returns with, of social investment is measured by assign -
Germany, Austria, Slovakia and Latvia. for example, the high level of social invest - ing equal weights to the three areas and the
ment in Denmark seen to be doing more to growth over 2007–2011 corresponds to the
Some countries are evolving ensure initial low levels of LTU than to con - average growth in the three areas.
towards a social investment tain the effects of economic shocks on LTU.
model, while others Member States that started with low lev-
are departing from it Table 2 summarises the development in els of social investment and whose invest -
real terms of social investment in specific ments were subsequently reduced further
Some of the Member States with relatively areas (education, unemployment, family) (Low/Decreased in the Table 2) represent a
high levels of social investment appear to across Member States since the recession. particular concern. Member States starting
have maintained the resilience of their sys - This assessment of the evolution towards a from low levels, but where social invest-
tems during the recession, as measured social investment model takes into account ments increased, are promising as it seems
in terms of levels of LTU and GDP — this the orientation of welfare systems before that they can expect the highest returns.
being particularly noticeable in the case the recession, with Member States divided In some Member States, social investment
in Germany, which managed to decrease into three groups (low/medium/high), based increased in some areas, while not in oth-
LTU. However Chart 51 suggests that, while on the level of investment in child day care ers. For instance, in Poland investment in
per relevant child population, mostly active education increased, while it decreased in
unemployment expenditure per unemployed child day care and active unemployment
80
( ) Based on Venn (2012) scoring of job-search,
monitoring and job sanctions. and education expenditure per relevant measures in real terms.
69