Page 69 - ePaper
P. 69
Chapter 1: The legacy of the crisis: resilience and challenges
that the crisis has increased the need for Chart 47: Real growth of family expenditure by type
social investment, although countries most (child day care versus all other) (2007–11)
in need of social investment tend to lag
76
behind (Kvist, 2013 ( )). 200
Since the onset of the recession, the pat- 150 High Medium Low
tern of social investment expenditure has 100
changed somewhat. While the trend towards
increasing social investment in children and % 50
families through childcare has continued,
investments targeted on the unemployed 0
and on education have weakened. How - Childcare
ever, such patterns differ widely between -50 Other
Member States with some clearly moving -100
towards a social investment model, while FI DK SE RO SI AT FR LU PT NL ES DE UK EL IT LT BG HU LV BE CY MT EE IE PL SK CZ
others appear to be moving away from it.
Source: ESSPROS.
The importance of investing Notes: The ranking of Member States is based on child day care expenditure per child in terms of GDP
and protecting people per capita in 2007 (Group High: above 50 % of maximum value; Group Medium: between 20 % and 50 %;
Group Low: below 20 %). The children population is defined from age 0 until the age at which at least 85 %
The evidence from the crisis suggests that of the children are enrolled in child day care. Data on child day care expenditure for EE, IE, PL, SK and CZ
are not reported as they are not reliable (ESSPROS report zero spending for one or more years).
an adequate level of social investment
helps people to continue to remain active
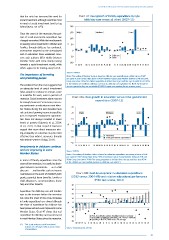
or available for work, even in periods of Chart 48a: Real growth in education versus total government
recession. Social investment alone may not expenditure (2007-12)
be enough, however. For instance, increas -
ing investments in education in most Mem - 30
ber States during the last decades have
not contained growing income inequalities 20 High Medium Low
just as improved employment opportuni-
ties have not always resulted in lower 10
levels of poverty (Salverda et al., 2014; % 0
OECD, 2011). In that respect it has been
argued that more direct measures aim - -10
ing at equality of outcomes may be more
effective than indirect measures through -20 Education
Total government expenditure
educational systems (Solga, 2014).
-30
Investments in childcare continue PT SI SE DK FI IT LV UK HU AT EE BE PL CY NL LT FR MT ES CZ EL BG DE IE LU RO SK
and are improving in some Source: COFOG.
Member States Notes: The ranking of Member States is based on education expenditure per young in terms of GDP
per capita in 2007 (Group High: above 90 % of maximum value; Group Medium: between 70 % and
In terms of family expenditure since the 90 %; Group Low: below 70 %). The young population is defined from the age until less than 85 %
of the children are not enrolled anymore in child day care until 24.
onset of the recession, it is useful to distin-
guish between investments — as in child
day care — and benefits such as income
maintenance in the event of childbirth, birth Chart 48b: Real development in education expenditure
grants, parental leave benefits, family or (2012 versus 2004–08) and relative educational performance
child allowances, accommodation, home (PISA test scores, 2012)
help and other benefits. 40
30
Expenditure for child day care and families
was on the increase before the recession 20
but, since the onset of the crisis, increases 10
in family expenditure have slowed although % 0
the share of expenditure for childcare has
been preserved and even improved in some -10
Member States. Chart 47 shows that real -20
expenditure for child day care has increased -30 PISA 2012 (Math, Science, Reading) versus EU average
in most Member States since the recession, Real public spending on education, 2012 versus 2004-08
Spending in % GDP, 2008 versus EU average
-40
( ) This study analyses social investment RO HU PT EL IT LV BG ES UK SI FI IE SE DK LT NL FR EE AT BE CZ DE PL SK LU
76
in terms of coverage it seems, not in terms Source: Vandenbroucke (2014).
of expenditure.
67
that the crisis has increased the need for Chart 47: Real growth of family expenditure by type
social investment, although countries most (child day care versus all other) (2007–11)
in need of social investment tend to lag
76
behind (Kvist, 2013 ( )). 200
Since the onset of the recession, the pat- 150 High Medium Low
tern of social investment expenditure has 100
changed somewhat. While the trend towards
increasing social investment in children and % 50
families through childcare has continued,
investments targeted on the unemployed 0
and on education have weakened. How - Childcare
ever, such patterns differ widely between -50 Other
Member States with some clearly moving -100
towards a social investment model, while FI DK SE RO SI AT FR LU PT NL ES DE UK EL IT LT BG HU LV BE CY MT EE IE PL SK CZ
others appear to be moving away from it.
Source: ESSPROS.
The importance of investing Notes: The ranking of Member States is based on child day care expenditure per child in terms of GDP
and protecting people per capita in 2007 (Group High: above 50 % of maximum value; Group Medium: between 20 % and 50 %;
Group Low: below 20 %). The children population is defined from age 0 until the age at which at least 85 %
The evidence from the crisis suggests that of the children are enrolled in child day care. Data on child day care expenditure for EE, IE, PL, SK and CZ
are not reported as they are not reliable (ESSPROS report zero spending for one or more years).
an adequate level of social investment
helps people to continue to remain active
or available for work, even in periods of Chart 48a: Real growth in education versus total government
recession. Social investment alone may not expenditure (2007-12)
be enough, however. For instance, increas -
ing investments in education in most Mem - 30
ber States during the last decades have
not contained growing income inequalities 20 High Medium Low
just as improved employment opportuni-
ties have not always resulted in lower 10
levels of poverty (Salverda et al., 2014; % 0
OECD, 2011). In that respect it has been
argued that more direct measures aim - -10
ing at equality of outcomes may be more
effective than indirect measures through -20 Education
Total government expenditure
educational systems (Solga, 2014).
-30
Investments in childcare continue PT SI SE DK FI IT LV UK HU AT EE BE PL CY NL LT FR MT ES CZ EL BG DE IE LU RO SK
and are improving in some Source: COFOG.
Member States Notes: The ranking of Member States is based on education expenditure per young in terms of GDP
per capita in 2007 (Group High: above 90 % of maximum value; Group Medium: between 70 % and
In terms of family expenditure since the 90 %; Group Low: below 70 %). The young population is defined from the age until less than 85 %
of the children are not enrolled anymore in child day care until 24.
onset of the recession, it is useful to distin-
guish between investments — as in child
day care — and benefits such as income
maintenance in the event of childbirth, birth Chart 48b: Real development in education expenditure
grants, parental leave benefits, family or (2012 versus 2004–08) and relative educational performance
child allowances, accommodation, home (PISA test scores, 2012)
help and other benefits. 40
30
Expenditure for child day care and families
was on the increase before the recession 20
but, since the onset of the crisis, increases 10
in family expenditure have slowed although % 0
the share of expenditure for childcare has
been preserved and even improved in some -10
Member States. Chart 47 shows that real -20
expenditure for child day care has increased -30 PISA 2012 (Math, Science, Reading) versus EU average
in most Member States since the recession, Real public spending on education, 2012 versus 2004-08
Spending in % GDP, 2008 versus EU average
-40
( ) This study analyses social investment RO HU PT EL IT LV BG ES UK SI FI IE SE DK LT NL FR EE AT BE CZ DE PL SK LU
76
in terms of coverage it seems, not in terms Source: Vandenbroucke (2014).
of expenditure.
67