Page 65 - ePaper
P. 65
Chapter 1: The legacy of the crisis: resilience and challenges
71
the crisis ( ). These findings are also gradient in health), a longer time-horizon the recession, this trust has decreased
illustrated by the qualitative analysis and country-specific analyses are needed across the Union, although a clear diver -
(see Annex 3, Extract 5). for a better assessment. gence can be seen between countries
that were less affected by the recession
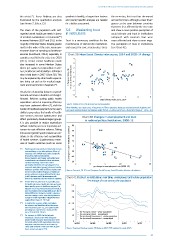
The share of the population with self- 3.4. Weakening trust and show a more positive perception of
reported unmet healthcare needs in terms in institutions social climate and trust in institutions
72
of medical examinations or treatment ( ) compared with countries that were
increased between 2007 and 2011 in the Trust is a necessary condition for the more affected and show a more nega-
majority of Member States. Despite greater maintenance of democratic institutions tive perception of trust in institutions
needs in the wake of the crisis, many gov- and respect for civic society rules. Since (see Chart 41).
ernments have cut spending on healthcare
services (Eurofound, 2014), especially in Chart 39: Mean Social Climate index scores, 2014 and 2009–14 change
countries most hit by the crisis since 2010 4
(OECD, 2014c). Unmet healthcare needs
also increased in some Member States 3 MT
where per capita real expenditure in sick - 2 HU
ness, healthcare and disability is still higher 1 LT DE
than it had been in 2007 (Chart 38). This BG LV IE EE UK AT SE LU DK
may be explained by other health expendi- Difference (2014-09) in social climate index score 0 FR BE FI NL
ture being cut such as for medical equip - -1 PT SK PL CZ
73
ment and investments in hospitals ( ). -2 EL RO IT ES SI
Clearly the relationship between expendi - -3 CY
ture and outcomes in health is not straight- -4 -6 -4 -2 0 2 4 6
forward. Reforms cutting public health Social climate index score, 2014
expenditure aimed at improving efficiency
may have undesired effects ( ), shift the Source: Fabian at al. (2014) based on Eurobarometer.
74
burden of healthcare payments to the user’s Note: Numbers are mean scores of responses to fifteen questions about personal and general situations and
perceived social protection and inclusion policy factors. SC-index scores have a theoretical range of –10 to +10.
ability to pay, reduce the bundle of health-
care services, increase waiting time and Chart 40: Changes in unemployment and trust
affect particularly disadvantaged groups. in national political institutions, 2008–12
It is also possible to reduce expenditure
without reducing access or improving out- 80
comes via cost-effective reforms. Taking 60 HU
into account gender-specific needs can con -
tribute to the efficiency and sustainability 40
of health systems. Supplementary meas - 20
ures of health outcomes (such as social % change in trust in institutions (2008-12) 0 DE BE SE UK EE BG
( ) People experiencing: a) reduced disposable income, FI NL CZ PL DK IE
71
increased living cost or debt problems; b) loss of -20 FR SK HR
insurance; c) the ‘twilight zone’, being marginally SI
beyond the entitlement threshold; -40 PT EL
d) new situations, not familiar with entitlements CY ES
or entitlements not adjusted to these situations; -60
e) reduced coverage; f) need for services -5 0 5 10 15 20
particularly affected by cuts; g) being part of an
increased-need patient group; h) closure of nearby pp change in unemployment rate (2008-12)
healthcare providers with insufficient ‘replacement Source: Eurostat, EU-LFS and European Social Survey, Social Situation Monitor calculations.
services’; i) decentralised financing of healthcare
services and taxes in areas affected by the crisis;
j) staff shortages; and k) discrimination with Chart 41: Distrust in institutions over time: unemployed and whole population
increased xenophobia and crisis-induced migration.
72
( ) Unmet need may also serve as a possible proxy Percentage of trust among the population
for health outcome as health outcomes are in part 60
determined by access to healthcare services. The
indicator on self-reported unmet need for medical
care may induce some comparability issues due to 50
cultural differences between countries. However,
over time changes can be more directly linked to
changes in health expenditure. http://www.echim. 40
org/docs/Final_Report_II_2012.pdf
( ) In Ireland, for instance, while expenditure % 30
73
for sickness and disability did not decrease
over the period 2007–11, per capita health
spending has experienced a sharp decline 20
since 2010 (OECD, 2014c). The European Union - whole population
74
( ) For instance, in 2006 the Netherlands 10 The European Union - unemployed
The (national) Government - whole population
introduced a dual system with obligatory The (national) Government - unemployed
private health insurance (covering short-term 0
care) and public health expenditure (covering Aut.2004 Aut.2006 Aut.2008 Sp.2010 Sp.2012
long-term care) increased in real terms by
10 %, while between 2000 and 2005 it grew Source: Standard Eurobarometer 80/ Autumn 2013: TNS opinion & social, 2013.
by an annual average of 2 %.
63
71
the crisis ( ). These findings are also gradient in health), a longer time-horizon the recession, this trust has decreased
illustrated by the qualitative analysis and country-specific analyses are needed across the Union, although a clear diver -
(see Annex 3, Extract 5). for a better assessment. gence can be seen between countries
that were less affected by the recession
The share of the population with self- 3.4. Weakening trust and show a more positive perception of
reported unmet healthcare needs in terms in institutions social climate and trust in institutions
72
of medical examinations or treatment ( ) compared with countries that were
increased between 2007 and 2011 in the Trust is a necessary condition for the more affected and show a more nega-
majority of Member States. Despite greater maintenance of democratic institutions tive perception of trust in institutions
needs in the wake of the crisis, many gov- and respect for civic society rules. Since (see Chart 41).
ernments have cut spending on healthcare
services (Eurofound, 2014), especially in Chart 39: Mean Social Climate index scores, 2014 and 2009–14 change
countries most hit by the crisis since 2010 4
(OECD, 2014c). Unmet healthcare needs
also increased in some Member States 3 MT
where per capita real expenditure in sick - 2 HU
ness, healthcare and disability is still higher 1 LT DE
than it had been in 2007 (Chart 38). This BG LV IE EE UK AT SE LU DK
may be explained by other health expendi- Difference (2014-09) in social climate index score 0 FR BE FI NL
ture being cut such as for medical equip - -1 PT SK PL CZ
73
ment and investments in hospitals ( ). -2 EL RO IT ES SI
Clearly the relationship between expendi - -3 CY
ture and outcomes in health is not straight- -4 -6 -4 -2 0 2 4 6
forward. Reforms cutting public health Social climate index score, 2014
expenditure aimed at improving efficiency
may have undesired effects ( ), shift the Source: Fabian at al. (2014) based on Eurobarometer.
74
burden of healthcare payments to the user’s Note: Numbers are mean scores of responses to fifteen questions about personal and general situations and
perceived social protection and inclusion policy factors. SC-index scores have a theoretical range of –10 to +10.
ability to pay, reduce the bundle of health-
care services, increase waiting time and Chart 40: Changes in unemployment and trust
affect particularly disadvantaged groups. in national political institutions, 2008–12
It is also possible to reduce expenditure
without reducing access or improving out- 80
comes via cost-effective reforms. Taking 60 HU
into account gender-specific needs can con -
tribute to the efficiency and sustainability 40
of health systems. Supplementary meas - 20
ures of health outcomes (such as social % change in trust in institutions (2008-12) 0 DE BE SE UK EE BG
( ) People experiencing: a) reduced disposable income, FI NL CZ PL DK IE
71
increased living cost or debt problems; b) loss of -20 FR SK HR
insurance; c) the ‘twilight zone’, being marginally SI
beyond the entitlement threshold; -40 PT EL
d) new situations, not familiar with entitlements CY ES
or entitlements not adjusted to these situations; -60
e) reduced coverage; f) need for services -5 0 5 10 15 20
particularly affected by cuts; g) being part of an
increased-need patient group; h) closure of nearby pp change in unemployment rate (2008-12)
healthcare providers with insufficient ‘replacement Source: Eurostat, EU-LFS and European Social Survey, Social Situation Monitor calculations.
services’; i) decentralised financing of healthcare
services and taxes in areas affected by the crisis;
j) staff shortages; and k) discrimination with Chart 41: Distrust in institutions over time: unemployed and whole population
increased xenophobia and crisis-induced migration.
72
( ) Unmet need may also serve as a possible proxy Percentage of trust among the population
for health outcome as health outcomes are in part 60
determined by access to healthcare services. The
indicator on self-reported unmet need for medical
care may induce some comparability issues due to 50
cultural differences between countries. However,
over time changes can be more directly linked to
changes in health expenditure. http://www.echim. 40
org/docs/Final_Report_II_2012.pdf
( ) In Ireland, for instance, while expenditure % 30
73
for sickness and disability did not decrease
over the period 2007–11, per capita health
spending has experienced a sharp decline 20
since 2010 (OECD, 2014c). The European Union - whole population
74
( ) For instance, in 2006 the Netherlands 10 The European Union - unemployed
The (national) Government - whole population
introduced a dual system with obligatory The (national) Government - unemployed
private health insurance (covering short-term 0
care) and public health expenditure (covering Aut.2004 Aut.2006 Aut.2008 Sp.2010 Sp.2012
long-term care) increased in real terms by
10 %, while between 2000 and 2005 it grew Source: Standard Eurobarometer 80/ Autumn 2013: TNS opinion & social, 2013.
by an annual average of 2 %.
63