Page 61 - ePaper
P. 61
Chapter 1: The legacy of the crisis: resilience and challenges
Chart 30: Employment rate of young people (20–29) no longer in education or training,
by number of years after obtaining highest level of education, for various cohorts
(i.e. year when obtaining highest level of education), EU-28
82
ER after 1 year
80 ER after 5 years
78
76
% 74
72
70
68 2002-03 2004-05 2006-07 2008-09 2010-11
66
64
2 3 4 5 6 7 8 1 2 3 4 5 6 7 8 1 2 3 4 5 6 7 1 2 3 4 5 1 2 3
Number of years after obtaining highest level of education
Source: Eurostat, LFS, DG EMPL calculations. Year of obtaining highest level of education is the variable HATYEAR.
Note: For the cohort 200607, the employment rate after 7 years is only available for those having left education in 2006; the same is true for the cohort
2008–09 after 5 years (only 2008 included) and for the cohort 2010–11 after 3 years (only 2010 included). For the cohort 2002–03, the employment rate
after one year is not available and the employment rate after one year is only available for those having left education in 2003.
of education ( 64 ) dropped from 79 % in Chart 31: Employment rate 5 years after completion of highest level
2008 to 71 % in 2013. of education, by cohort by country, in % (for young people aged 20–29,
no longer in education or training)
What appears to be important from an
operational and policy perspective is 100
whether the effects of these negative 90
labour market experiences for current 80
generations will persist over time. In this 70
respect Chart 26 shows that, before the 60
crisis, the employment rate of entrants % 50
was relatively low in the first year but 40 2002-03
2004-05
steadily increased in the following years. 30 2006-07
2008-09
This is not the case for the cohorts of 20
young people who left education after 10
2006 and have had to face the full 0
effects of the recent recession. EU-28 DE UK SE LT FR IT ES
In fact, some five years after enter- Source: Eurostat, LFS, DG EMPL calculations. Year of obtaining highest level of education is the
ing the labour market, the employment variable HATYEAR.
rate of the 2008–09 cohort is below Note: For the cohort 2008–09, the employment rate after 5 years is only available for those having left
the level recorded for the two previ- education in 2008.
ous cohorts (2004–05 and 2006–07).
While the gap between the 2008–09 Since employment rates are largely influ - seems to have suffered less than pre-
generation and the previous ones enced by the economic cycle, it is difficult vious cohorts. In Lithuania this may be
65
diminishes over time ( ), this is due to to judge whether the long-term effects explained by the rather strong economic
a worsening outcome of the previous are already visible. In addition, it is not recovery and also by the fact that many
generations rather than a real catch yet possible to observe the outcomes for young people migrated to other countries.
up effect. a prospective generation that will hope- In Italy and Spain (and to some extent
fully be entering the labour market at a France), sharp declines in the employment
64
( ) The EU-LFS does not indicate the year of time of robust economic recovery or even rate can be seen five years after having
entry into the labour market and one has to
use a proxy which is the ‘year of obtaining to use the previous generation as a refer - left education, with each generation per-
highest level of education’. As young people ence point. forming worse than the previous one ( ).
66
may have continued their studies after that
year without obtaining necessarily a higher
level diploma, there may some bias as those The labour market outcomes of young The level of education appears to have
having for instance a theoretical presence
of 3 years in the labour market may have people five years after completing their played a protective role during the
just entered after having been three years highest level of education vary across
in education though without succeeding in
getting a higher diploma. countries (see Chart 31). In Germany, the ( ) In Spain and Italy, the 2008-9 cohort has,
66
65
( ) The outcome of the ‘unlucky’ 2008-9 cohort employment rate increased for all cohorts five years after having left education,
is, relative to the previous one (2006-7), less while in the United Kingdom, Sweden employment rates of around 20 and 15 pps
unfavourable after 5 years (gap by 2 pps) respectively below those for the 2002-03
than after one year (gap by 5 pps). and Lithuania the 2008–09 generation cohort, while it is around 10 pps for France.
59
Chart 30: Employment rate of young people (20–29) no longer in education or training,
by number of years after obtaining highest level of education, for various cohorts
(i.e. year when obtaining highest level of education), EU-28
82
ER after 1 year
80 ER after 5 years
78
76
% 74
72
70
68 2002-03 2004-05 2006-07 2008-09 2010-11
66
64
2 3 4 5 6 7 8 1 2 3 4 5 6 7 8 1 2 3 4 5 6 7 1 2 3 4 5 1 2 3
Number of years after obtaining highest level of education
Source: Eurostat, LFS, DG EMPL calculations. Year of obtaining highest level of education is the variable HATYEAR.
Note: For the cohort 200607, the employment rate after 7 years is only available for those having left education in 2006; the same is true for the cohort
2008–09 after 5 years (only 2008 included) and for the cohort 2010–11 after 3 years (only 2010 included). For the cohort 2002–03, the employment rate
after one year is not available and the employment rate after one year is only available for those having left education in 2003.
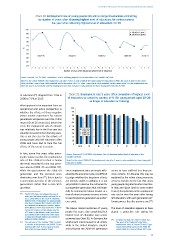
of education ( 64 ) dropped from 79 % in Chart 31: Employment rate 5 years after completion of highest level
2008 to 71 % in 2013. of education, by cohort by country, in % (for young people aged 20–29,
no longer in education or training)
What appears to be important from an
operational and policy perspective is 100
whether the effects of these negative 90
labour market experiences for current 80
generations will persist over time. In this 70
respect Chart 26 shows that, before the 60
crisis, the employment rate of entrants % 50
was relatively low in the first year but 40 2002-03
2004-05
steadily increased in the following years. 30 2006-07
2008-09
This is not the case for the cohorts of 20
young people who left education after 10
2006 and have had to face the full 0
effects of the recent recession. EU-28 DE UK SE LT FR IT ES
In fact, some five years after enter- Source: Eurostat, LFS, DG EMPL calculations. Year of obtaining highest level of education is the
ing the labour market, the employment variable HATYEAR.
rate of the 2008–09 cohort is below Note: For the cohort 2008–09, the employment rate after 5 years is only available for those having left
the level recorded for the two previ- education in 2008.
ous cohorts (2004–05 and 2006–07).
While the gap between the 2008–09 Since employment rates are largely influ - seems to have suffered less than pre-
generation and the previous ones enced by the economic cycle, it is difficult vious cohorts. In Lithuania this may be
65
diminishes over time ( ), this is due to to judge whether the long-term effects explained by the rather strong economic
a worsening outcome of the previous are already visible. In addition, it is not recovery and also by the fact that many
generations rather than a real catch yet possible to observe the outcomes for young people migrated to other countries.
up effect. a prospective generation that will hope- In Italy and Spain (and to some extent
fully be entering the labour market at a France), sharp declines in the employment
64
( ) The EU-LFS does not indicate the year of time of robust economic recovery or even rate can be seen five years after having
entry into the labour market and one has to
use a proxy which is the ‘year of obtaining to use the previous generation as a refer - left education, with each generation per-
highest level of education’. As young people ence point. forming worse than the previous one ( ).
66
may have continued their studies after that
year without obtaining necessarily a higher
level diploma, there may some bias as those The labour market outcomes of young The level of education appears to have
having for instance a theoretical presence
of 3 years in the labour market may have people five years after completing their played a protective role during the
just entered after having been three years highest level of education vary across
in education though without succeeding in
getting a higher diploma. countries (see Chart 31). In Germany, the ( ) In Spain and Italy, the 2008-9 cohort has,
66
65
( ) The outcome of the ‘unlucky’ 2008-9 cohort employment rate increased for all cohorts five years after having left education,
is, relative to the previous one (2006-7), less while in the United Kingdom, Sweden employment rates of around 20 and 15 pps
unfavourable after 5 years (gap by 2 pps) respectively below those for the 2002-03
than after one year (gap by 5 pps). and Lithuania the 2008–09 generation cohort, while it is around 10 pps for France.
59