Page 57 - ePaper
P. 57
Chapter 1: The legacy of the crisis: resilience and challenges
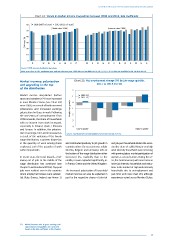
Chart 24: Trends in market income inequalities between 2008 and 2012, Gini coefficient
60 2008 (2007 ref. year) 2012 (2011 ref. year)
Stable since 2008 Increase since 2008
50
40
Gini Index (%) 30
20
10
0
PL SK NL SE CZ BE FI PT DK SI LU EE AT IT DE FR ES UK EL IE
Source: OECD, income distribution database.
Note: year refers to SILC production year and not reference year. 2008 data not available for SE, DE, IT, FR, IT. 2012 data not available for BE. No data for HU.
Market incomes: polarisation Chart 25: Net employment change (%) by job-wage quintile,
and upgrading in the top 2011 to 2013, EU-28
of the distribution
2
Market income inequalities (before 1 2008-10
taxes and transfers) ( ) have increased 2011-13
55
in most Member States (see Chart 24) 0
since 2008, as a result of both increased
joblessness and increased earnings Employment growth -1
polarisation for those in work. Following
the worsening of unemployment from -2
2008 onwards, the share of households -3
with no income from work increased,
especially in Ireland, Spain, Lithuania -4
and Greece. In addition, the polarisa- Lowest quintile Highest quintile
tion of earnings from work increased as Source: Eurofound (2014c) calculations, based on Eurostat, EU-LFS.
a result of the widening of the hourly
wage distribution, a greater dispersion
in the quantity of work among those and contributed positively to job growth in and job-poor households. Before the reces-
employed, and of the quantity of work countries where the recession was milder sion the share of adults living in very high
within households. (Austria, Belgium and Germany). Jobs at work intensity households was increasing
the bottom of the wage distribution either with growing labour market participation of
In recent years, the trend towards a hol- decreased less markedly than in the women as second earners. During the cri-
lowing out of jobs at the middle of the middle, or even expanded significantly, as sis, this trend reversed, with an increase in
wage distribution has continued (see in France, Greece and the United Kingdom. lower job intensity households and reduc-
Chapter 3 and Eurofound 2014c). Top-paid tions in the number of high work intensity
jobs were resilient even in the countries The increased polarisation of household households due to unemployment and
where employment losses were substan- market incomes can also be explained in part-time work (see Chart 26), although
tial (Italy, Greece, Ireland, see Annex 1) part by the respective shares of job-rich experiences varied across Member States.
55
( ) Market incomes refer to gross earnings and
capital income. Inequalities are measured
based on the Gini coefficient in this Chapter.
55