Page 56 - ePaper
P. 56
Employment and Social Developments in Europe 2014
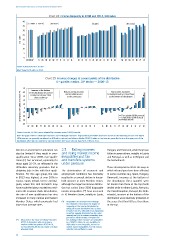
Chart 22: Income inequality in 2008 and 2013, Gini index
40
2008 2013* Increase Stable Decrease
35
30
25
Gini Index 20
15
10
5
0
EU-28 EU-27 SI DK HU LU HR CY IT EE ES EL SK CZ SE FI AT MT DE IE FR LT BG NL BE UK PL RO PT LV
Source: Eurostat, EU-SILC, ilc_di12.
Note: *Data for IE refers to 2012.
Chart 23: Incomes changes at several points of the distribution
th
(1 quintile, median, 10 decile) — 2008–13
st
50
Incomes at the bottom Bottom and top incomes faster/decreased less than those
Top incomes increased
40
Change between 2008 and 2013 (%) -10 0
of the distribution decreased
decreased/increased
less/increased more than
30
at the same pace
at the bottom of distribution
those at the top
20
10
-20
Tenth decile (10 % richest)
Median income
-30
-40 First quintile (20 % poorest)
LV RO UK PT NL DE MT PL BG EL IE LT FR BE AT FI ES HU EE IT CY LU DK SI SE CZ SK
Source: Eurostat, EU-SILC, prices adjusted by consumer prices (HICP), Eurostat.
Note: The graph refers to 20 % lowest incomes and 10 % highest incomes. Asymmetrical percentiles have been chosen for the following reasons. The lowest
10 % incomes are generally considered as difficult to capture (see Atkinson-Marlier 2010). Studies on top incomes generally focus on the upper part of the
distribution, often top 1pc incomes or 5pc top incomes (see OECD 2013a). Data for IE refers to 2012.
Returns on investment in education can 2.3. Falling incomes Hungary and Denmark, while they have
also be limited if they result in over- and rising market income fallen in seven others, notably in Latvia
qualification. Since 2008, over-qualifi- inequalities put tax and Portugal as well as in Belgium and
cation ( ) has increased, especially for and transfers systems the Netherlands.
53
those aged 25–34, as reflected in the under pressure
difficulties university graduates find in These developments reflect the ways in
obtaining jobs in line with their quali- The deterioration of economic and which rich and poor have been affected.
fication. For this age group, the rate employment conditions has inevitably In some countries (e.g. Spain, Hungary,
in 2013 was highest, at over 30 %, in resulted in an overall decline in house- Denmark), incomes at the bottom of
Cyprus, Spain, Ireland, Greece and Bul- hold incomes in most Member States, the distribution (first quintile) were
garia, where this skill mismatch may although the impact on income distribu- hit harder than those at the top (tenth
have made the labour market less resil- tion has varied. Since 2008 disposable decile) while in others (Latvia, Romania,
54
ient to the economic shock. Nevertheless, income inequalities ( ) have increased the United Kingdom, Portugal, the Neth-
the rate of over-qualification has also in 10 Member States, notably in Spain, erlands), incomes at the bottom of the
increased in many Central and Eastern distribution were relatively protected, in
54
Member States which previously had ( ) Inequalities are measured here through the sense that they fell less than those
lower than average rates. the Gini index. It measures the degree of at the top.
inequality of the income distribution by
taking all income distribution into account.
It varies from 0 to 100, with 0 corresponding
to perfect equality (everyone has the same
income) and 100 to extreme inequality (one
person has all the income, everyone else
( ) Measured as the share of tertiary-educated has nothing). Other measures of inequalities
53
(ISCED 5–8) workers who are in low or (e.g. S80/S20 ratio) are also available for
medium-skilled occupations (ISCO 4–9), disposable income inequality, but not for
i.e. that theoretically do not require a tertiary market income inequalities. For this reason,
education level. only the Gini coefficient is used.
54