Page 77 - ePaper
P. 77
Chapter 1: The legacy of the crisis: resilience and challenges
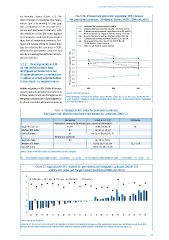
six Member States (Chart 57). The Chart 56: Employment protection legislation (EPL) indexes
main changes in countries like Spain, for permanent contracts, 18 Member States, 2000, 2008 and 2013
which saw a narrowing of the gap,
was a reduction in EPL for both tem- Continued pre-existing upward trend: IE
porary and permanent contracts, with Stopped downward trend during crisis: AT, FI, PL and SE
Stopped previously upward trend during crisis: BE and DE
the reduction in the EPL rules applied Reversed previously negative direction during crisis: DK
to permanent contracts being greater Reversed previously positive direction during crisis: FR
Continued pre-existing downward trend: CZ, PT and SK
than that of temporary contracts. Por- No change before the crisis: ES, EL, HU, IT, NL, UK
tugal and Greece chose to reduce their 18 EU Member States average
Other 12 EU Member States average
gap by reducing the strictness of EPL
afforded to permanent contracts but 3.4
also by increasing that afforded to tem- 3.2
porary contracts. 3.0
2.8
5.2.2. Developments in EPL 2.6
do not seem to have had Employment Protection Legislation Index 2.4
an impact on transitions out 2.2
of unemployment or reductions 2.0
in labour market segmentation 1.8
in the short- to medium-term 1.6
1.4
Neither reductions in EPL (Table 4) for per- 2000 2008 2013
manent contracts during the recession (as in Source: OECD EPL database.
Estonia, Spain, Greece and Portugal) nor for Note: Arithmetic average of EPL indexes across Member States. BG, CY, EE, HR, LT, LU, LV, MT, RO and
temporary contracts (as in Spain) appear to SI not included. Employment protection legislation (EPL) Index refers to permanent contracts (individual
be clearly correlated with improvements in and collective dismissals).
Table 4: Changes in EPL index for permanent contracts
(individual and collective dismissals) and temporary contracts, 2008–11
DECREASE STABLE (+/– 0.1) INCREASE
Permanent contracts (individual and collective dismissals)
High EPL index ( ) EL, PT IT, DE, FR, NL, SI BE
1
Medium EPL index ES SE, SK, SI, LU, CZ
Low EPL index EE UK, IE, FI, DK, HU, PL, AT
Temporary contracts
High EPL index ES EL, FR, SI, IT, LU
Medium EPL index AT, BE, EE, FI, PL, HU CZ, PT, SK
Low EPL index UK, IE, NL, DE, SE, DK
Notes: Groups of Member States are defined for each EPL category.
( ) For permanent contracts high EPL index = >2.8, medium = 2.5–2.8, low = <2.5. For temporary contracts high EPL index = >2.49, medium = 1.8–2.5, low = <1.8
1
Chart 57: Gap between EPL indexes for permanent and temporary contracts (2004–13)
and the EPL index just for permanent contracts (2008 and 2013)
4
2008 gap 2011 gap 2013 gap 2008 perm 2013 perm
3
2
1
0
-1
-2
LU EE ES FR EL SK HU BE IT PL SI AT IE DK FI UK PT CZ LV DE SE NL
Source: OECD EPL database.
Note: BG, CY, HR, LT, LU, LV, MT, RO and SI not included. EPL index for individual dismissals used for gap between permanent and temporary contracts (v3),
but just the EPL index for permanent contracts (black and blue diamonds marker) includes individual and collective dismissals (also v3).
75