Page 80 - ePaper
P. 80
Employment and Social Developments in Europe 2014
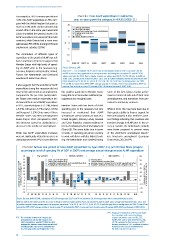
For example, in 2010 Germany spent almost Chart 61: Total ALMP expenditure in real terms,
41 % of its ALMP expenditure on PES, com- year on year growth by category, for EA15 (2005-11)
pared with the United Kingdom that spent as 15
much as 81 %, while Sweden devoted only Start-up incentives
around 23 %. In the same year Ireland and 10 Direct job creation
Supported employment and rehabilitation
Latvia channelled the greatest share of its Employment incentives
Training
ALMP expenditure into training (45 % in both 5 Labour market services
countries), while Estonia had a more even
split between PES (38 %), training (26 %) and % 0
employment subsidies (26 %). -5
The contribution of different types of -10
expenditure to the growth of ALMP expendi -
ture in real terms (Chart 62) suggests that -15
Member States with high levels of spend- 2005-07 2007-11 2006 2007 2008 2009 2010 2011
ing on ALMP prior to the recession (e.g. Source: Eurostat, LMP.
Germany, Belgium, Ireland, Austria, Finland, Note: EA-15 = EA-18 without FR, PT and ES due to substantial breaks in series. Two values for DK
France, the Netherlands and Denmark) and EE erased as they appeared to be wrong and were disturbing the calculation. EL and UK 2010
values used also for 2011. Due to breaks in series no values used for PL, ES, HU, SK prior to 2008 so
weathered it better than others. 2008–2011 average used instead of 2007–2011. Due to certain categories having missing values only
totals reported for CY, DK, EE, EL, HU, IE, IT, LT, LV, NL, RO, SE, SI, UK. Due to missing values for 2005
It also suggests that the evolution of ALMP CY and MT not reported in 2005–2007 average and due to break in series PT not included in 2007–11
average. Due to break in series FR average 2007–2010 used instead of 2007–2011.
expenditure during the recession did not
move in line with trends in unemployment. this could be partly due to Member States some of the best labour market perfor -
Compared to the pre-crisis period, Mem- being able to accommodate additional par- mances in terms of exits out of short-term
ber States with medium expenditure lev- ticipants at low marginal costs. unemployment, and transitions from per-
els lowered their overall ALMP expenditure manent to temporary contracts.
in 2011, namely Bulgaria (–12.1 %), Poland Member States with low levels of ALMP
(–6.3 %), Lithuania (–5.7 %), Italy (–5.6 %) spending prior to the recession, but who While in 2011 this may have been due to
and Hungary (–1.2 %). Since none of these increased or maintained their ALMP their greater ability to finance support for
Member States saw their unemployment spending per person wanting to work (e.g. their unemployed, it also reinforces previ -
levels drop in 2011 compared to 2007, United Kingdom, Estonia, Latvia, Slovakia ous findings indicating that countries who
this decrease cannot be attributed to a and Czech Republic), showed resilience in invested strongly in ALMP prior to the cri-
decrease in the number of unemployed. terms of containing levels of unemployment sis (e.g. Sweden, the Netherlands, Finland)
(Chart 63). The same holds true in terms were better prepared to prevent many
While real ALMP expenditure increases of levels of spending per person wanting of the short-term unemployed becom-
were not significantly related to increases in to work, with those with the highest levels ing long-term unemployed (European
unemployment levels ( 103 ), it is possible that (e.g. the Netherlands and Sweden) having Commission, 2012a) ( 104 ).
Chart 62: Annual real growth of total ALMP expenditure by type (2007-11), per Member State grouped
according to level of spending (% of GDP in 2007) and average annual change in total ALMP expenditure
40 Low spenders Medium spenders High spenders 60
35 Start-up incentives (lhs) Training (lhs) 50
Labour market services (lhs)
Direct job creation (lhs)
Average annual change in ALMP expenditure by category, % 20 5 0 30 Average annual change in total ALMP expenditure, %
30
Supported employment and rehabilitation (lhs)
Average annual change in total ALMP expenditure (rhs)
40
Employment incentives (lhs)
Countries without breakdown for all categories (lhs)
25
15
20
10
10
0
-5
-10
-20
-15 -10
-20 -30
EE MT UK RO CY LV SI SK CZ EL LT HU BG LU PT IT PL DE BE IE AT ES FI FR NL SE DK EA-15
Source: Eurostat, LMP. DG EMPL calculations of EA-18 average value. ES, FR and PT not included in EA-18 average value due to substantial breaks in series.
Note: EL and UK 2010 values used for 2011. Due to breaks in series no values used for PL, ES, HU, SK prior to 2008 so 2008–2011 average used instead of 2007–2011. Due
to certain categories having missing values all categories reported for CY, DK, EE, EL, HU, IE, IT, LT, LV, NL, RO, SE, SI and UK in grey. Due to missing values for 2005 CY and MT not
reported in 2005–2007 average and due to break in series PT not included in 2007–11 average. Due to break in series FR average 2007–2010 used instead of 2007–2011.
( ) European Commission, (2012a) concludes
104
that countries with successful labour
( ) The correlation between the change in the market institutions such as UBs, SSS,
103
unemployment rate and the change in real ALMPs, EPL and in-work benefits (e.g. NL,
ALMP expenditure is weak (R2=0.08) even after SE, FI) managed to limit increase in LTU
removing the Member States that increased ALMP despite increases in STU, resulting in highest
spending despite a decrease in unemployment transition rates out of unemployment
(e.g. Germany, Austria and Belgium) (R2=0.16). for both LTU and STU (p. 65).
78