Page 81 - ePaper
P. 81
Chapter 1: The legacy of the crisis: resilience and challenges
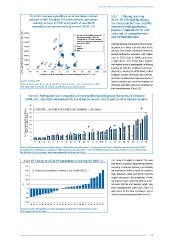
Chart 63: Average expenditure on active labour market 5.3.2. Lifelong learning
policies (ALMP) including PES client services, per person in the EU fell slightly during
wanting to work (in PPS) and growth of real ALMP the recession but has recently
expenditure per person wanting to work (2007–11) recovered with potentially
positive implications for exit
8 000 NL The size of the bubble represents rates out of unemployment
ALMP expenditure per person wanting to work 2011, pps 5 000 ES PT HU CZ FR UK FI SE AT DE CY Worst Lifelong learning, measured in terms of par -
and competitiveness
the average value of the rate
7 000
of exits out of STU and transition
rate from temporary to permanent
6 000
contracts in 2012
ticipation in training and education in the
Medium
Best
previous four weeks, increased relative to
4 000
periods before the recession, with higher
3 000
rates in 2013 than in 2008, apart from
2 000
a slight dip in 2011 (Chart 64). Countries
with higher levels of participation in lifelong
PL
1 000
SK
LT
RO
SI
LV
0
ployed (e.g. Sweden, the Netherlands, United
-20
-60
-40
-80
60
80
40
0
20
Kingdom, Austria, Denmark) also had bet-
Change in real ALMP expenditure per person wanting to work 2007-11, % 100 EE 120 learning for both the employed and unem-
ter labour market performances in terms of
Source: Eurostat, LMP. higher transition rates out of unemployment
Note: No data for BG, DK, EL, HR, IT and MT for 2007 and 2011, and no data for EE in 2007. and lower transition rates from employment
The 2010 value is used for UK in 2011. Insufficient data for BE, IE and LU.
into unemployment (Chart 55).
Chart 64: Participation rate in education and training (lifelong learning) (last four weeks) of employed
(2008, 2011 and 2013), unemployed (2011) and inactive persons (2011) aged 25–64 in selected countries
45 2008 empl 2011 empl 2013 empl 2011 unemployed 2011 inactive
40
% of people participating in lifelong learning by labour status 30
35
25
20
15
10
0 5
EL HU SK PL IT IE LT LV *BE CY *DE MT PT ES CZ EU-28 EE SI *AT *LU *UK *NL *FR *FI *SE *DK
Source: Lifelong learning data from Eurostat (trng_lfs_02); Member States indicated by * are among the top 25 most competitive countries in the world in 2013,
according to the competitiveness ranking from Global Competitiveness Index 2013–14 from the World Economic Forum. Due to breaks in series no data reported
for 2008 for CZ, LV, LU, NL and PT, and no data reported for 2008 and 2011 for FR.
Chart 65: Change in real ALMP expenditure on training (%) 2007–11 This range of evidence supports the view
that there is a positive relationship between
250 investing in lifelong learning and tackling
200 Change in real expenditure on training as part of ALMP 2007-11 unemployment. In this respect the countries
150 that, between 2008 and 2013, had the
largest increases in the proportion of their
100 unemployed who undertook lifelong learn-
% 50 ing were Estonia and Sweden, which saw
0 their unemployment rates fall in 2010–13
with some of the best transitions out of
-50
short-term unemployment (see Chart 5).
-100
-150
SK PL LT EL HU LU RO BG IT SE DE BE UK FR ES AT FI NL DK IE CZ MT SI LV CY EE
Source: Eurostat, LMP database, DG EMPL calculations. No data for PT due to breaks in series.
2010 values used for UK and EL.
79