Page 84 - ePaper
P. 84
Employment and Social Developments in Europe 2014
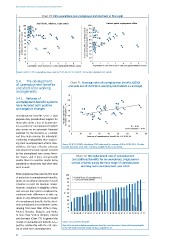
Chart 70: PES expenditure per unemployed and methods to find a job
Ask friends, relatives, trade unions 100 HR LT SK CZ Contact public employment office
100
% of unemployed who ask friends, relatives or trade unions to find a job 70 BG UK LT PL EE MT FI EU-28 FR LU BE AT NL DE DK % of unemployed who contact public employment services to find a job 70 LV EE PT SI MT IE FI EU-28 FR BE SE AT NL DE DK
RO
HR
SI
LV
CZ
90
90
HU
ES
IT
CY IE
LU
80
80
SK
PT
PL
HU
60
60
50
50
RO
BG
40
40
CY
IT
30
30
ES
20
10
10
0
0 1 2 SE 3 4 5 6 7 20 0 0 1 2 3 4 5 6 7
Expenditure in LM services per 1 000 unemployed (Millions Euros) Expenditure in LM services per 1 000 unemployed (Millions Euros)
Source: LMP, LFS. 2011 expenditure values used for CY, ES, FR, IE, LT, LU, MT, PL, SK. No data available for EL and UK.
5.4. The development Chart 71: Coverage rates of unemployment benefits (2010)
of unemployment benefits and exits out of short-term unemployment (2010–11 average)
and short-time working
arrangements
70
5.4.1. Reforms of 60
unemployment benefit systems AT
have included both positive 50 CY CZ DK EE
and negative changes 40 MT SE LV UK SI FR FI DE
Unemployment benefits serve a dual Transition rate from STU to employment 2010-11, % 30 IT PL SK RO LT PT ES HU
purpose: they provide direct support for 20 BG HR
those who suffer a loss of income dur- EL
ing a period of unemployment (which 10 R² = 0.19
also serves as an automatic financial 0 Coeff correlation = 0.44
stabiliser for the economy as a whole), 0 10 20 30 40 50 60 70 80
and they help maintain the individual’s Coverage of unemployment benefits for STU 2010, %
continuing employability thus support-
ing their re-employment efforts. Nev- Source: EU LFS, DG EMPL calculations. 2012 value used for coverage of UK in 2010. 2011-12 value
ertheless, the type, effective coverage used for transitions of DE and PT. No data available for BG, IE, LU and NL.
and amount of income support received
by the unemployed vary across Mem-
ber States, and it does not generally Chart 72: Net replacement rate of unemployment
enable them to maintain similar living and additional benefits for an unemployed, single person
standards to those they had when they without children, during the early stage of unemployment
were in work. and long-term unemployment, year 2012
When people lose their jobs the first level 100
of protection is unemployment benefits, 90 Initial Phase of unemployment
which are contributory (insurance-based) 80 Long-term unemployed
schemes in most EU Member States. 70
However, variations in eligibility criteria 60
and average time spent in employment,
combined with differences in take-up, % 50
result in very different levels of receipt 40
of unemployment benefits for the short- 30
term unemployed across Member States, 20
ranging from less than 20 % in Italy, 10
Poland, Slovakia, Bulgaria and Malta 0 EL RO MT UK LT SE HU PL IE AT EE FI ES IT DE DK BE SK FR SI CZ NL PT BG LU LV CY
to more than 50 % in Belgium, Finland
and Germany (Chart 73). In general the
receipt of unemployment benefits has a Source: OECD, tax-benefit model.
positive relationship with the exit rates Note: After tax and including unemployment benefits, social assistance, family and housing benefits
th
out of short-term unemployment. in the 60 month of benefit receipt. No data available for CY.
82