Page 88 - ePaper
P. 88
Employment and Social Developments in Europe 2014
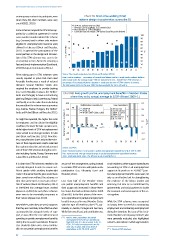
on temporary contracts to participate; even Chart 79: Short-time working (STW)
when they did, their numbers were very scheme design characteristics across the EU
small (OECD, 2010).
STW net replacement rate (rhs)
Average cost to employer in 1st month (rhs)
Some schemes required the STW to be sup - + Max duration of STW 2009 (lhs)
Countries that introduced STW during Great Recession (below)
ported by a collective agreement. In some 25 100
cases worker councils initiated the scheme 90
(e.g. Germany) and in others only workers 20 80
eligible for unemployment insurance were 70
allowed to take part (Boeri and Bruecker, 15 60
2011). In general the participation of the No. of months 50 %
social partners in the design and introduc- 10 40
tion of the STW schemes was seen to be 30
an essential success factor for ensuring a 5 20
fast and timely implementation (Eurofound, 10
2010; European Commission, 2011c). 0 0
SK+ BE CZ+ DK PL+ HU SI* FR NL+ IT PT AT DE ES
Firms taking part in STW schemes were Source: Chart made using data from Boeri and Bruecker (2011).
usually required to prove that their need Note: Cost to employer = percentage of normal total labour cost for a single worker without children
who usually earns the average wage; STW net replacement rate = benefit from STW schemes as
for public funding was a result of reduced percentage of last wage; Maximum duration = maximum duration of STW schemes in months.
demand. Several Member States also The information refers to the year 2009. No data available for LV, LT, RO and SI.
required the employer to provide training
(e.g. Czech Republic, Hungary, the Nether - Chart 80: Real growth partial unemployment benefits in Member States
lands and Portugal), to have a restructuring where they exist, annual average in 2007–09 and 2009–11
plan (e.g. Belgium, Italy, Luxembourg, Poland
and Spain), or not to make dismissals during 200 0.4
the period that the scheme was in operation High/medium expenditure Low expenditure
(e.g. Austria, France, Hungary, the Nether - 150 2008-09 In AT increase 0.3
2010-11
from 0.4 mil euro
lands and Poland) (Boeri and Bruecker, 2011). 100 % GDP 2007 (right scale) in 2007 to 113.5 0.2
in 2009 and
to 6.1 in 2011
As might be expected, the higher the costs then decreased
for employers and the stricter the eligibility Real growth (annual average), % 50 0.1 % GDP
conditions, the lower the take-up rates were, 0 0
while higher levels of STW net replacement
rates served to encourage workers to take -50 -0.1
part (Boeri and Bruecker, 2011). Neverthe -
less, many Member States reduced the strict - -100 BE DE EL IT NL SI FI ES FR LT AT PT -0.2
ness of their requirements and/or extended
the maximum duration and net replacement Source: ESSPROS.
rate of their STW schemes during the reces- Notes: Diamond markers corresponds to partial unemployment expenditure in % of GDP in 2007.
sion including Austria, France, Germany and Bars represent real average annual changes in partial unemployment expenditure between
Latvia (Boeri and Bruecker, 2011). 2007–2009 and 2009–2011. The left axis is cut at 200 % for AT.
It is clear that STW schemes needed to be as part of the arrangement, opting instead small relative to other support expenditures
carefully designed in order to ensure suf- to combine STW schemes with public works (accounting for 8 % of all unemployment
ficient uptake while avoiding deadweight participation (e.g. Lithuania; Boeri and support at its peak use in 2009) ( ), par-
112
costs in the sense that the jobs would have Bruecker, 2011). tial unemployment benefits were seen not
been saved even without the scheme, or only as an effective tool for strengthening
that they prevented a necessary reloca - Less than half of the Member States the resilience of the labour market and
tion of workers (Boeri and Bruecker, 2011) use partial unemployment benefits and economy, but also as a commitment by
or inefficient low average hours worked their usage only increased in those Mem- governments and social partners to tackle
(Arpaia et al, 2010). As such, these schemes ber States that had used them before 2008 the economic and social aspects of the cri-
were seen to be essentially temporary in (Chart 80). In the first phase of the reces- sis together.
their nature (Arpaia et al, 2010). sion, expenditure for partial unemployment
benefits increased in most Member States While the STW schemes were recognised
Nevertheless, when they are used, it appears with this type of benefit in place ( ), par- as having been successful in maintaining
111
that they are most likely to be effective when ticularly in Austria, Portugal and Germany. employment and containing unemployment
accompanied by adequate levels of sup- While their overall cost and contribution was during the downturn, the issue of the treat-
port, as was often the case with increased ment of workers on temporary contracts, who
111
spending on partial unemployment benefits ( ) Before 2008, expenditure for partial were generally excluded, also highlighted
unemployment benefits was particularly
during the recession (see below). However, high in BE and, to a lesser extent in DE, EL, concerns about labour market segmentation.
care should be taken since some countries IT, NL, FI. Partial unemployment benefits
were also in place, with a low level of
did not use partial unemployment benefits expenditure, in ES, FR, LT, AT and PT. ( ) Eurostat LMP database.
112
86