Page 90 - ePaper
P. 90
Employment and Social Developments in Europe 2014
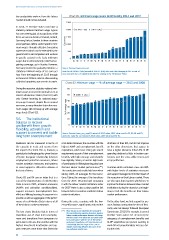
low-productivity workers from the labour Chart 81: Minimum wage levels (EUR/month), 2014 and 2007
market should not be excluded.
2 500
In 2014, 21 Member States now have a
statutory national minimum wage. Cyprus 2 000 2007 - July 2014 - July
has one covering just six occupations, while
there are none in Austria, Denmark, Finland, 1 500
Germany, Italy or Sweden. In these countries Euro/month
social partners define sector-specific mini- 1 000
mum wages through collective bargaining
agreements (which can be extended by the 500
government to all companies and workers
in specific sectors) or de facto minimum 0
wages due to extremely high collective bar - BG RO LT CZ LV HU SK EE HR PL PT EL MT ES SI UK FR IE NL BE LU
gaining coverage, as in Austria. However,
Germany decided to gradually introduce a Source: Eurostat (earn_mw_cur).
statutory minimum wage of 8.5 euro per Note: for HR 2008S2 (July) instead of 2007S2 (July). Also note that changing to PPS as unit of
hour from the beginning of 2015 through measurement does not significantly alter the ranking of the EU Member States.
to the end of 2016 in order to allow existing
collective bargaining agreements to expire. Chart 82: Minimum wage — % of average wage — 2013 and 2008
During the recession, statutory national min - 60
imum wages increased in nominal terms in
almost all Member States (Chart 81) with 50 2008 2013
only Greece lowering its national statu -
tory wage. However, despite these nominal 40
increases, in many Member States the mini - % of average wage 30
mum wages did not keep up with average
wage levels (Chart 82). 20
5.6. The institutional 10
balance to recover
and benefit from growth: 0 CZ EE RO ES HR SK BG UK IE LV PT NL PL HU LT MT LU FR EL SI
flexibility, activation and
support to prevent and tackle Source: Eurostat (earn_mw_avgr2). Instead of 2013 value, 2012 value used for EE, RO, NL and FR,
long-term unemployment and 2011 value for EL. Instead of 2008 value, 2009 value used for NL.
Resilience can be measured in terms of crisis better. Moreover, the countries with the strictness of their EPL, but did not improve
the capacity to resist and recover from highest ALMP and unemployment benefit on the other dimensions that appear to
the impact of a shock. This is, however, a expenditure, which have strong job-search have a higher relevance (Chart 83). ALMP
particularly challenging policy given that an requirements as part of their unemployment spending declined a little in bottom per -
effective triangular relationship between benefits, with high coverage and relatively formers over the crisis, while it increased
employment protection measures, labour low eligibility criteria, as well as high levels in top performers.
market activation measures, and systems of participation in lifelong learning, also have
of social support is difficult to achieve at the best labour market performance( 115 ). Countries which combined a less strict EPL
the best of times. The conclusions and results hold even when with higher levels of activation measures
taking 2009–13 averages for the transi - and support managed to limit the impact of
Charts 83 and 84 use an index that is a tions. Taking the average of the transitions the recession on their labour market. There
sum of the characteristics of each Member from the 2005–08 period and comparing are also signs that countries which chose to
State in terms of EPL, activation measures it with the labour market institutions index improve the balance between labour market
(ALMPs and activation conditionalities), for 2007 there is also a clear positive link institutions during the recession are begin-
support measures (unemployment ben - between better transitions and better labour ning to feel the benefits on their labour
efits) and lifelong learning. Its purpose is to market institutions. market performance.
provide us with an aggregate of the perfor-
mance of each Member State in terms of all During the crisis, countries with the low - On the other hand, we find support for pre-
of their labour market institutions. est performance, significantly reduced the vious findings noting that the idea of flexi-
curity was not always followed (European
115
The two charts illustrate that in terms of ( ) Note: Estonia is not included in the average of Commission, 2012f). For example, in several
the top-performing countries despite its positive
transitions out of short-term unemploy - labour market performance because only larger Member States where EPL decreased, the
ment and transitions from temporary to Member States were taken into account in order adequacy of unemployment benefits and
to try and balance with the size of the bottom
permanent contracts, the countries with the performers. Nevertheless, its inclusion does not ALMP expenditure per person wanting to
highest investment in activation and sup - substantially alter the shape of the curve or work did not proportionately increase dur-
relative relationship between the curve of the
port measures were those that faired the top and bottom performers. ing the crisis.
88