Page 94 - ePaper
P. 94
Employment and Social Developments in Europe 2014
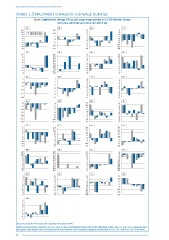
Annex 1: Employment change by job-wage quintile
Chart: Employment change (%) by job-wage wage quintile in EU-28 Member States,
2011 Q2–2013 Q2 and 2012 Q2–2013 Q2
AT BE BG CY
12 15 5 4
10 2012Q2-13Q2 4 2
8 2011Q2-13Q2 10 3 0
6 5 2 -2
4 0 1 -4
2 0 -6
0 -5 -1 -8
-2 -2 -10
-4 -10 -3 -12
-6 -15 -4 -14
CZ DE DK EE
10 4.0 8 12
8 3.5 6 10
3.0
6 2.5 4 8
4 2.0 2 6
2 1.5 -2 0 4 2
1.0
0 0.5 -4 0
-2 -0.5 0 -6 -2
-4 -1.0 -8 -4
ES EU FI FR
5 3 4 5
0 2 3 2 4 3
-5 1 1 0 2 1
-10 -1 0 -1 -1 0
-2
-3
-15 -2 -3 -2
-4
-5
-20 -3 -5 -4
EL HR HU IE
0 4 12 6
-5 2 10 8 5 4
-10 -2 0 6 3 2
-15 -4 4 2 1 0
-20 -6 0 -1
-2
-8
-25 -10 -2 -3
-4
-4
-30 -12 -6 -5
IT LT LU LV
2 14 20 30
1 12 15 25
0 10 8 10 20
-1 6 5 15
-2 4 10
-3 2 0 5
-4 -2 0 -5 0
-5 -4 -10 -5
-6 -6 -15 -10
MT NL PL PT
14 4.0 12 2
12 3.5 10 0
10 3.0 8 -2
8 -4
6 2.5 6 -6
4 2.0 4 -8
2 1.5 2 -10
-14
-2 0 1.0 0 -12
-4 0.5 -2 -16
-6 0.0 -4 -18
-8 -0.5 -6 -20
RO SE SI SK
5 6 6 15
4 5 4 10
3 4 2
2 3 0 5
1 2 -2 0
-1 0 1 0 -4 -5
-6
-2 -1 -8 -10
-3 -2 -10
-4 -3 -12 -15
-5 -4 -14 -20
UK
6
5
4
3
2
1
0
-1
-2
Source: Eurostat, EU-LFS, Eurofound’s calculations (Eurofound 2014).
Notes: Data missing for Germany for 2011 Q2–2012 Q2 due to classification change. Data for the Netherlands refer to 2011 Q2–2012 Q2. EU aggregate data
incorporates data adjustments for Germany and the Netherlands to reflect changed occupational classifications in 2012–2013 and 2011–2012 respectively.
92