Page 91 - ePaper
P. 91
Chapter 1: The legacy of the crisis: resilience and challenges
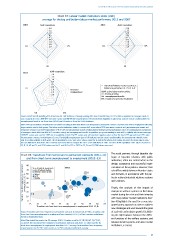
Chart 83: Labour market institutions index (LMII),
average for the top and bottom labour market performers, 2012 and 2007
2007 ALMP expenditure 2012 ALMP expenditure
2.0 2.0
1.5 1.5
1.0 1.0
0.5 0.5
0 0
-0.5 -0.5
-1.0 -1.0
-1.5 -1.5
LLL -2.0 EPL LLL -2.0 EPL
UB UB
2012 ALMP expenditure
2.0
1.5
1.0
0.5
0 Top LM performers: AT, UK, DE, DK & SE
LLL -0.5 Bottom LM performers: EL, ES, PL & IT
-1.0 Activation
-1.5 conditionalities ALMP: active labour market policies
-2.0 LLL: lifelong learning
UB: unemployment benefits
EPL: employment protection legislation
UB EPL
Source: ALMP and UB spending data from Eurostat LMP database, Lifelong learning data from Eurostat (trng_lfs_02), data on opinions of managers (part of
LLL component) is from IMD WCY executive survey and IMD World Competitiveness Yearbook 2012, eligibility requirements and job-search conditionalities for
unemployment benefits are from Venn (2012) and EPL index is from the OECD database.
Notes: The top and bottom LM performers are ranked according to their transitions from temporary to permanent contracts and exits from STU to employment with only
large countries used in both groups. The labour market institutions index is a composite Z-score index of EPL (permanent contracts and gap between permanent and
temporary contracts v3), ALMP (expenditure in % of GDP and activation/job search conditionalities), lifelong learning (participation rates of total population and opinions
of managers about skills from IMD WCY executive survey) and unemployment benefits (expenditure per person wanting to work in PPS, eligibility criteria and coverage).
2008 EPL values were used for 2007 due to availability of data. The EPL values were all turned into negative values so that the lowest EPL gap and lowest EPL value
for permanent contracts had the highest Z-score. The eligibility requirements (part of UB indicator) and job-search conditionalities for unemployment benefits have
only 2012 data available in both years. The UB spending for 2012 uses 2011 values, expect for EL and UK for whom 2010 values are used. The mean value in 2012
for each indicator is that of the 2007 scores in order to be able to compare the 2012 scores with those of 2007. For 2012 ALMP expenditure 2011 values used for CY,
ES, IE, LU, MT and PL, and 2010 values used for EL and UK. For EPL in 2007 for EE, LU and SI, 2008 values were used.
Chart 84: Transitions from temporary to permanent contracts (2011–12) The social partners, through bipartite dia -
and from short-term unemployment to employment (2012–13) logue or tripartite relations with public
authorities, often are central actors in the
design, acceptance and successful imple -
Transition rate from temporary to permanent contracts 2011-12, % 60 Worst SK PL PT EU-27 FI SE CZ SI DE UK DK AT and domains, in accordance with the par-
80
mentation of these policies. However, their
2012
Size of bubble represents
70
score of labour market
role differs widely between Member States
institutions index (LMII)
EE
Best
ticular national industrial relations systems
Middle
50
and traditions.
HU
40
30
Finally, the analysis of the impact of
changes in welfare systems on the labour
20
NL
10
with many labour market institutions (Sec-
0
tion 4) highlights the need for a more inte-
15 EL 20 25 ES 30 IT 35 40 FR 45 50 55 60 65 market during the crisis and their interplay
grated policy approach in order to address
Transition rate from short-term unemployment to employment 2012-13, %
new challenges and work towards the goals
Source: Transition rate from temporary to permanent contracts from Eurostat, EU-SILC.; transition rate of a job-rich and inclusive growth. Establish-
from short-term unemployment to employment from Eurostat, EU-LFS, ad-hoc transition calculations ing the right balance between the differ -
based on longitudinal data. ent functions of the welfare systems, and
Note: Blue dotted line marks the EU average. 2010–11 values used for CY, HR, HU, MT, PL, PT, RO,
SE and SK for transitions from temporary to permanent contracts and 2010–11 value used for NL between benefit systems and labour market
short-term unemployment to employment transition. EU-27 average for transitions from temporary institutions, is crucial.
to permanent from EU-SILC and for exits out of STU calculated arithmetic average.
89