Page 87 - ePaper
P. 87
Chapter 1: The legacy of the crisis: resilience and challenges
Chart 76: Maximum duration for the least and most entitled 5.4.2. Short-time working
groups of unemployed, 2007 (min) and 2014 (min and max) arrangements and partial
unemployment benefits helped
50 BE: unlimited
45 Min 2007 Short-time working schemes (STW) are
Min 2014
40 Max 2014 publicly funded schemes intended to allow
35 firms facing reduced demand to temporarily
reduce the working hours of their workers
Months 30 and organise a form of work-sharing, while
25
20 providing income-support to the workers
15 affected. The aim of STW schemes is to
10 prevent the excessive loss of jobs that are
5 viable in the long-term during an economic
downturn (Hijzen and Martin, 2013).
0
HU CY MT SK UK IE CZ LT LV AT BG EE EL IT PL RO SI* SE FI DE DK ES LU PT FR NL BE
Such schemes were quite extensively used
Source: MISSOC. in some Member States during the reces-
Note: When calculating the minimum duration, the longest duration for the least entitled group was sion and were seen as successful in helping
taken, whereas for maximum, the longest specified duration for the most entitled group was taken, maintain employment and contain unem-
not including those with disability status or with special status due to being over the age of 55.
*Note that in the case of Slovenia the minimum duration has changed due to a new category being ployment (Hijzen and Venn, 2010; Euro -
introduced, so the coverage of the least entitled actually increased. found, 2010; Boeri and Bruecker, 2011;
Cahuc and Carcillo, 2011; Hijzen and Mar-
tin, 2013) especially when combined with
Chart 77: Non-coverage of social benefits: share of working-age partial unemployment benefits (Arpaia et
people that are poor, living in a jobless household and not al, 2010), thereby reducing the hysteresis
receiving benefits (< 10 % of total household income) (2010) effect of the downturn. There is also some
evidence that the requirement to partici -
50 pate in training as part of such schemes
45 2008 2011 also improved the employability of those
40 concerned (Eurofound, 2010).
35
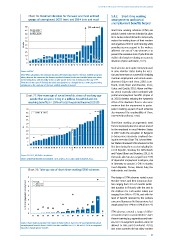
30 Short-time working arrangements went
% 25 from being largely absent or almost unused
20 20 by the employed in most Member States
15 in 2007 (with the exception of Belgium)
10 to being more intensively employed dur -
ing the recession (Chart 78). Several Mem-
5 ber States introduced STW schemes for the
0
FI LU FR BE NL SI UK DK SK HU DE IE SE CZ LT ES EU-27 MT EE AT PL HR PT LV RO IT BG EL CY first time during the recession including the
Czech Republic, Slovakia, the Netherlands
and Poland (Boeri and Bruecker, 2011). At
Source: EU-SILC, DG EMPL calculations. their peak, take-up rates ranged from 7.5 %
Note: Family/child benefits not included. For IE and BE 2011 value used instead of 2012.
of dependent employment in Belgium, 4 %
in Germany to around 1–2 % in Austria,
Czech Republic, France, Ireland, Italy, the
Chart 78: Take-up rate of short-time working (STW) schemes Netherlands and Slovakia.
8 7 Peak The design of STW schemes varied across
Member States with their maximum dura-
% of total (dependent) employment 6 5 4 3 ited duration in Finland), with the cost to
2007 Q4
tion ranging from 3 to 24 months (unlim-
2010 Q4
the employer for each worker taking part
ranging from 0 % to 47.5 %, and with the
level of benefit received by the workers
concerned (compared to their previous last
2
wage) going from 49 % to 100 % (Chart 79).
1
STW schemes covered a range of differ -
0
PL HU SK AT* NL* PT* CZ ES DE* FR* IE FI IT* BE* DK ent workers but in several Member States
those in training (e.g. apprentices and train-
Source: Chart made using data from Hijzen & Martin (2013). Data on STW accompanied by partial ees) or in management positions were not
unemployment benefits from ESSPROS. No data available for LV, LT, RO and SI. *STW accompanied allowed to take part (Eurofound, 2010),
by partial unemployment benefits. and most countries did not allow workers
85
Chart 76: Maximum duration for the least and most entitled 5.4.2. Short-time working
groups of unemployed, 2007 (min) and 2014 (min and max) arrangements and partial
unemployment benefits helped
50 BE: unlimited
45 Min 2007 Short-time working schemes (STW) are
Min 2014
40 Max 2014 publicly funded schemes intended to allow
35 firms facing reduced demand to temporarily
reduce the working hours of their workers
Months 30 and organise a form of work-sharing, while
25
20 providing income-support to the workers
15 affected. The aim of STW schemes is to
10 prevent the excessive loss of jobs that are
5 viable in the long-term during an economic
downturn (Hijzen and Martin, 2013).
0
HU CY MT SK UK IE CZ LT LV AT BG EE EL IT PL RO SI* SE FI DE DK ES LU PT FR NL BE
Such schemes were quite extensively used
Source: MISSOC. in some Member States during the reces-
Note: When calculating the minimum duration, the longest duration for the least entitled group was sion and were seen as successful in helping
taken, whereas for maximum, the longest specified duration for the most entitled group was taken, maintain employment and contain unem-
not including those with disability status or with special status due to being over the age of 55.
*Note that in the case of Slovenia the minimum duration has changed due to a new category being ployment (Hijzen and Venn, 2010; Euro -
introduced, so the coverage of the least entitled actually increased. found, 2010; Boeri and Bruecker, 2011;
Cahuc and Carcillo, 2011; Hijzen and Mar-
tin, 2013) especially when combined with
Chart 77: Non-coverage of social benefits: share of working-age partial unemployment benefits (Arpaia et
people that are poor, living in a jobless household and not al, 2010), thereby reducing the hysteresis
receiving benefits (< 10 % of total household income) (2010) effect of the downturn. There is also some
evidence that the requirement to partici -
50 pate in training as part of such schemes
45 2008 2011 also improved the employability of those
40 concerned (Eurofound, 2010).
35
30 Short-time working arrangements went
% 25 from being largely absent or almost unused
20 20 by the employed in most Member States
15 in 2007 (with the exception of Belgium)
10 to being more intensively employed dur -
ing the recession (Chart 78). Several Mem-
5 ber States introduced STW schemes for the
0
FI LU FR BE NL SI UK DK SK HU DE IE SE CZ LT ES EU-27 MT EE AT PL HR PT LV RO IT BG EL CY first time during the recession including the
Czech Republic, Slovakia, the Netherlands
and Poland (Boeri and Bruecker, 2011). At
Source: EU-SILC, DG EMPL calculations. their peak, take-up rates ranged from 7.5 %
Note: Family/child benefits not included. For IE and BE 2011 value used instead of 2012.
of dependent employment in Belgium, 4 %
in Germany to around 1–2 % in Austria,
Czech Republic, France, Ireland, Italy, the
Chart 78: Take-up rate of short-time working (STW) schemes Netherlands and Slovakia.
8 7 Peak The design of STW schemes varied across
Member States with their maximum dura-
% of total (dependent) employment 6 5 4 3 ited duration in Finland), with the cost to
2007 Q4
tion ranging from 3 to 24 months (unlim-
2010 Q4
the employer for each worker taking part
ranging from 0 % to 47.5 %, and with the
level of benefit received by the workers
concerned (compared to their previous last
2
wage) going from 49 % to 100 % (Chart 79).
1
STW schemes covered a range of differ -
0
PL HU SK AT* NL* PT* CZ ES DE* FR* IE FI IT* BE* DK ent workers but in several Member States
those in training (e.g. apprentices and train-
Source: Chart made using data from Hijzen & Martin (2013). Data on STW accompanied by partial ees) or in management positions were not
unemployment benefits from ESSPROS. No data available for LV, LT, RO and SI. *STW accompanied allowed to take part (Eurofound, 2010),
by partial unemployment benefits. and most countries did not allow workers
85