Page 82 - ePaper
P. 82
Employment and Social Developments in Europe 2014
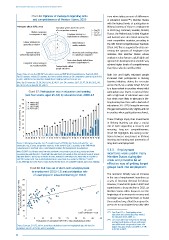
Chart 66: Opinions of managers regarding skills Even when taking account of differences
and competitiveness of Member States, 2013 in education levels ( 105 ), Member States
with the highest levels of participation in
Managers about skills, 2013 Education system meets the needs lifelong learning of those in employment
of a competitive economy Top EU in 2013 (e.g. Denmark, Sweden, Finland,
Worker motivation 8 EU-26
in companies is high Employee training is a Last EU France, the Netherlands, United Kingdom
6 high priority in companies and Austria) were also listed among the
4 most competitive countries, according to
Labour relations are Skilled labour is
generally productive 2 readily available the IMD World Competitiveness Yearbook
0 (Chart 64). This is supported by data con-
cerning the opinions of employers that
Apprenticeship is Attracting and retaining talents
sufficiently implemented is a priority in companies indicates that Member States whose
employers value human capital highly and
Brain drain (highly skilled) does approach its development in a holistic way
Competent senior managers not hinder competitiveness
are readily available Foreign highly skilled achieve higher levels of competitiveness
people attracted than those who do not (Chart 66).
Source: Data is from the IMD WCY executive survey and IMD World Competitiveness Yearbook 2013. Both low and highly educated people
Top EU countries include EU countries that were ranked among top 20 competitive countries (out of 60)
in 2013 and the last EU countries include those ranking in places from 40–60. increased their participation in lifelong
Note: Top EU countries: SE, DE, DK, LU, NL, IE, UK, FI. Last EU countries: LV, IT, ES, PT, SK, HU, SI, EL, RO, learning initiatives during the recession
BG, HR. EU-26: no data for MT and CY. across the EU as a whole (Chart 67), but
to a lesser extent in countries where initial
Chart 67: Participation rate in education and training participation was lowest. In general those
(last four weeks, aged 25–64) by education level, 2008–13 with a high level of education were over
45 four times more likely to take part in life-
40 2008 high long learning than those with a low level of
2008 low
education in 2013 ( ). During the recession
106
% of people participating in LLL 30 in countries where participation was lowest.
2013 high
35
this gap narrowed, but only slightly, and not
2013 low
25
These findings imply that investments
20
in lifelong learning can play a crucial
15
10
ensuring long-run competitiveness.
5 role in both supporting a recovery and
Chart 68 highlights the strong corre -
0 lation between investment in lifelong
BG RO HR HU EL SK LT PL IE LV BE CY *DE IT *LU EU-28 CZ ES EE MT PT SI *UK *NL *AT *FR *FI *SE *DK
learning and training and prevention of
Source: Lifelong learning data from Eurostat (trng_lfs_03); Member States indicated by * are long-term unemployment.
among the top 25 most competitive countries in the world in 2013, according to the ‘IMD World
Competitiveness Yearbook 2013’, International Institute for Management Development. 5.3.3. Employment
Note: ISCED97 classification used: low education level corresponds to pre-primary, primary and lower
secondary education (levels 0–2); and high education level corresponds to first and second stage of tertiary incentives were used in many
education (levels 5 and 6). Due to breaks in series, instead of 2008 values, the 2009 value is used for LU Member States during the
and 2010 value for NL. Due to substantial breaks in series, there is no value for 2008 for CZ and PT, crisis and proved to be an
or for 2008 high for LV. No ‘low’ is shown for BG, RO, HR, SK, LT, CY and (2008 only) EE, due to low reliability.
effective way of getting target
Chart 68: Exit rate out of short-term unemployment groups back into employment
to employment (2012–13) and participation rate
of unemployed in education/training (in 2012) The recession initially saw an increase
70 EE AT in the use of employment incentives as
a way of boosting demand for labour.
Exit rate out of short-term unemployment, to employment (2012-13) 60 SK BG HU FR PL CY DE CZ IT IE LV MT ES SI PT UK NL FI DK SE Member States either began to see the
However, it reached its peak in 2009 and
experienced a sharp decline in 2011 as
50
beginnings of an economic recovery and
40
LT
no longer saw a need for them, or found
30
they could no long afford them given the
HR
pressures to consolidate their public debt
20
RO
R² = 0.33
10
105
education and training (last four weeks)
0 EL Coeff correlation = 0.58 ( ) See Chart 67 — Participation rate in
by education level, 2008–13.
0 5 10 15 20 25 30 35 40 45 106
Participation of unemployed (25-64) to education/training in 2012 ( ) The exact difference between the lifelong
learning participation of those with lower
Source: Eurostat, EU-LFS, ad-hoc transition calculations based on longitudinal data. No data for education levels compared to those with
higher education levels is 18.6 % vs. 4.4 %
transitions out of STU for BE and LU available. in EU-28 in 2013.
80