Page 79 - ePaper
P. 79
Chapter 1: The legacy of the crisis: resilience and challenges
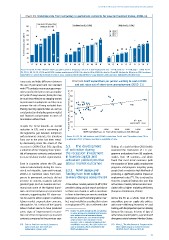
Chart 59: Transition rate from temporary to permanent contracts for selected Member States, 2008–12
Low level of temporary
80 contracts [0-5%] Medium level [5-10%] High level [>10%]
70 2008
2010
% of temporary year before 50
2012
60
40
30
20
10
0
LT SK BG UK RO EE MT EL IT DK LU CZ LV HU BE AT FR ES NL PL CY PT FI SI DE SE
Source: Eurostat, EU-SILC. Member States grouped by level of temporary contracts in total employment: low = 0–5 %, medium = 5–10 %, high = >10 %. For CY,
PL, PT, LU, HU, SK, SE, LT, RO and MT 2011 values used instead of 2012. No data for UK in 2008. No data for IE and HR. No data for DK prior to 2012 and none
reported for LT and LV due to break in series in 2012. Countries which reduced their EPL gap between 2008 and 2011 indicated by the white bars.
Large costs and rights differences between Chart 60: ALMP expenditure per person wanting to work (2010)
the use of permanent and non-standard and exit rates out of short-term unemployment (2010–11)
work ( 100 ) contracts may encourage compa -
nies to opt for the latter. From an employ- 70
ee’s point of view, however, these jobs may 60
be much less effective as stepping-stones AT DE NL
to permanent employment and they may 50 EE CZ
increase the risk of being excluded from 40 LV UK CY SI FI SE FR
lifelong learning opportunities as well as Transitions from STU to employment 2010-11, % LT PL HU ES PT IE
social protection (including pension rights) 30 RO SK
and financial compensation in cases of 20
termination without fault. 10 EL R² = 0.25
Despite the trend towards an overall 0 Correl coeff = 0.50
reduction in EPL and a narrowing of 0 1 000 2 000 3 000 4 000 5 000 6 000 7 000
the legislative gap between temporary ALMP expenditure (cat. 1.1-7) per person wanting to work 2010, pps
and permanent contracts, the transition Source: EU-LFS, EU-LMP database and DG EMPL calculations. For NL and PT transitions from STU to
from one to the other has been stead- employment 2011-12 figures used due to availability of data.
ily decreasing since the onset of the
recession in 2008 (Chart 59), signalling 5.3. The development findings of a study by Kluve (2010) which
a reduction of the ‘stepping stone’ poten- of activation during examined the conclusions of 137 pro-
tial of temporary contracts and potential the recession: investment gramme evaluations from 96 academic
increase in labour market segmentation. in human capital and studies from 19 countries, and which
activation yielded positive found that most ALMP measures (with
Even in countries where the EPL gap labour market outcomes the exception of direct public employment
reduced substantially during the reces- programs and programs targeting young
sion (Czech Republic, Spain and Portugal, 5.3.1. ALMP design and people) had a modest to high likelihood of
2008–11) transition rates from tem- funding have been subject producing a significant positive impact on
porary to permanent contracts did not to many changes across the EU employment rates ( 102 ). This is echoed by
increase. In contrast, countries with the Chart 60. Empirical findings also note that
greatest gaps (such as Sweden and Ger - Active labour market policies (ALMPs) that active labour market policies are also asso -
many) saw some of the highest transi- provide training and job search assistance ciated with a higher matching efficiency
tion rates from temporary to permanent to those out of work as well as incentives ( European Commission, 2014c).
contracts, suggesting that EPL alone can - to firms to hire them, are seen to contribute
not be used to either explain or address positively to a well-functioning labour mar - Across the EU as a whole, most of this
labour market segmentation concerns, ket, most notably by speeding their return expenditure goes on supply side policies,
although the 2012 reform of the Spanish to employment ( 101 ). This is reflected in the with some 59 % being devoted to PES and
labour market seems to have produced training, with the proportion spent on training
101
some signs of improvement in transi- ( ) Section 4.2 above already touches on spending being on the increase. In terms of type of
on active and passive unemployment measures
tion rates from temporary to permanent in its analysis of social investment during active labour market policies, a great deal of
contracts compared to the previous year. the crisis. However, its assessment of mostly divergence exists between Member States.
active measures does not include several
measures such as supported employment and
102
100
( ) Such as fixed-term contracts, temporary rehabilitation measures, direct job creation and ( ) Kluve, J., ‘The effectiveness of European active
agency work, part-time work and start-up incentives, which are included in the labor market programs’, Labour Economics
independent contract work. ALMP calculations here. 01/2010, Vol. 17, No 6, pp. 904–18.
77