Page 35 - ePaper
P. 35
Job creation, productivity and more equality for sustained growth
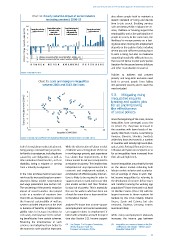
Chart 34: Poverty reduction impact of social transfers also allows people both to maintain a
(excluding pensions), 2008-13 decent standard of living and devote
time to job search. Enabling services
10 Poverty after and before Poverty before transfers Poverty before transfers Poverty after and before such as training, Public Employment Ser -
2008-13 change in poverty rates (points) -2 4 2 0 people in society. At the same time, the
8
vices, childcare or housing support the
decreased or kept
increased or stable,
transfers decreased
transfers increased
poverty after
stable, poverty after
employability and active participation of
6
transfers decreased
transfers increased
likelihood to escape poverty on a last-
ing basis when moving into employment
depends on the quality of jobs, including
decent pay and sufficient working hours
-4
to earn a living, but also on measures
-6
Change in poverty before social transfers (2008-13)
their level of labour market participation
-8
(taxation for the second earner, childcare
EE
CY
ES
NL
UK
BG
LV FI RO AT Change in poverty after social transfers (2008-13) PT IE* IT LT FR SK SI LU EL supporting households willing to increase
CZ
DE
HU
PL
DK
SE
BE
MT
and other reconciliation measures).
Source: Eurostat EU-SILC.
Policies to address and prevent
poverty and long-term exclusion need
Chart 35: Level and changes in inequalities both to prevent people from falling
between 2008 and 2013. Gini Index into persistent poverty and to reach the
most excluded.
4
CY EE ES 5.3. Mitigating rising
Change in inequalities (Gini) 2008-13 -1 1 0 SI SE CZ FI BE AT MT FR DE IE EU-27 PL EL LT BG PT RO training and quality jobs
3
LU
inequalities requires
HU
HR
DK
2
IT
for all and improving
the effectiveness
SK
of social policies
-2
inequalities have converged across the
-3
EU (Chart 35). They have increased in
-4 NL UK LV Since the beginning of the crisis, income
20 25 30 35 40 the countries with lower levels of ine-
Inequality in 2008 (Gini) quality (Denmark, Croatia, Luxembourg,
Hungary, Slovenia, Slovakia, Sweden),
Source: Eurostat, Gini coefficient of equivalised disposable income (source: SILC) (ilc_di12).
while they have decreased in a number
of countries with initially high levels (Bul -
lack of strong labour market attachment, While the deterioration of labour market garia, Latvia, Portugal, Romania). Greece,
being young or old and being in particu- conditions was a strong driver of the rise Lithuania and Spain are exceptions in so
lar family circumstances, including those in working-age poverty, past experience far as inequalities have increased from
caused by care obligations; as well as has shown that improvements in the their already high levels.
other individual characteristics, such as labour market do not necessarily lead to
disability, being a migrant or coming a reduction in poverty. This implies that, Income inequalities are primarily formed
from a minority background. independent of any improvement in the on the labour market reflecting both
economic and employment outlook, a labour market exclusion and a polarisa-
In the crisis all these factors have been combination of effective policy interven - tion of earnings of those in work. Mar-
reinforced by increased long-term unem - tions is likely to be required in order to ket income inequalities (i.e. referring to
ployment, labour market segmentation support returns to work and ensure that the distribution of incomes before taxes
and wage polarisation (see Section 4.2). jobs enable workers and their families and transfers) among the working-age
85
The weakening of the poverty reduction to stay out of poverty. This is especially population ( ) have increased in at least
impact of social transfers also played the case for workers who have been out 15 Member States (Chart 36) with the
a role in a number of countries (see of work for some time or have weak ties largest increases in those countries hit
Chart 34), as measures taken to restore to the labour market. hardest by the crisis notably Ireland,
the financial sustainability of welfare Greece, Spain and Estonia, but also
84
systems included reductions in the level Analysis ( ) shows that income support Denmark, Slovenia, Germany, France,
or duration of benefits, or tightened eli- (unemployment and social assistance) Austria and Italy.
gibility rules to increase incentives to can support returns to employment if
seek work, and may have led to exclud- linked with activation and well designed While rising unemployment obviously
ing beneficiaries from certain schemes. (see also Section 3.2). Income support increases the income gap between
Restoring the effectiveness of such
85
84
schemes and adapting them better to ( ) See Chapter 2 in European Commission, ( ) Inequalities are measured based on the Gini
coefficient in this Chapter – OECD, Income
2013c, Chapters 3 and 4 in
the economic cycle would be important. European Commission, 2011a. Inequality Update 2014.
33