Page 36 - ePaper
P. 36
Employment and Social Developments in Europe 2014
those in and out of work, the crisis has Mitigating rising inequalities therefore inequalities as analysed by the OECD in
86
also led to a further widening of labour requires actions to address the forces their latest report on inequalities ( ).
market inequalities among those in work. driving labour market (earnings) inequal -
This is because well paid, full-time jobs ity, preventing and tackling long-term As illustrated in Section 3.2, participation
remained relatively well protected, while unemployment and improving the effec - in training protects workers from unem-
lower-paid workers often ended up with tiveness and efficiency of social protec- ployment and increases the chances of
fewer hours worked and less take-home tion systems. the short-term unemployed going back
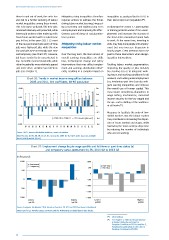
pay. In fact, in the years 2011-12 most to work. At the same time, investing in
of the new permanent jobs and full-time Mitigating rising labour market skills may help more people into employ -
jobs were high-paid jobs while the new inequalities ment but may increase dispersion in
low-paid jobs were increasingly part-time hourly wages. Great attention has to be
and temporary (see Chart 37). Likewise, Over the long term, the main drivers of paid to these interactions when design-
job losses tended to be concentrated in overall earnings inequalities are skills ing policy interventions.
low- to middle-income households, while bias, technological change and policy
richer households were relatively spared interventions that may affect employ- Tackling labour market segmentation,
and more often combine two full-time ment and earnings distribution differ- improving the quality of jobs (notably
jobs (see Chapter 1). ently, resulting in a complex impact on by ensuring access to adequate work-
ing hours and working conditions for all
Chart 36: Trends in market income inequalities between workers) and tackling underemployment
2005 and 2011, Gini coefficient, 18-65 population (e.g. involuntary part-time) can also miti -
gate earning inequalities and improve
0.08 0.6 the overall use of human capital. This
may require considering adaptations to
0.4 wage-setting mechanisms, increased
0.04 income security for the low waged and
0.2
the up- and re-skilling of the workforce
87
0 0 at all levels ( ).
-0.2 Measures to facilitate the entry of low-
-0.04 skilled workers into the labour market
2005-08 2008-11 2011 level (right axis) -0.4 may contribute to increasing the disper-
sion of hours worked and wages, while
-0.08 -0.6
LU PL SK SE BE CZ NL DE IT PT FI AT UK DK FR EE SI IE EL ES narrowing the total earnings dispersion
by reducing the number of individuals
Source: OECD, Income distribution database, own’s calculations. who are not working.
Note: No data for HU, HR, MT, CY, LT, LV ; no data for 2005 for SE, DE, IT; 2011 data not available
for BE (2010) and NL (2012).
Chart 37: Employment change by job-wage quintile and full-time or part-time status (a)
and temporary versus permanent (b), EU, 2011 Q2 to 2013 Q2
In thousands
1 000 1 000
Permanent
Temporary 500 Part-time
Full-time
500
0
5
0 -500
-1 000
-500
-1 500
-1 000 -2 000
Lowest Highest Lowest Highest
quintile quintile quintile quintile
Source: European Job Monitor 2014, based on Eurostat, EU-LFS and SES (Eurofound calculations)
Note: Data for 26 Member States; Germany and the Netherlands excluded due to data breaks.
86
( ) OECD (2013).
( ) See Chapter 1, ‘Shifts in the job structure
87
in Europe during the recession’ in
European Commission (2011a) and Box 3,
‘Employment polarisation in the crisis’ in
European Commission (2013d).
34
those in and out of work, the crisis has Mitigating rising inequalities therefore inequalities as analysed by the OECD in
86
also led to a further widening of labour requires actions to address the forces their latest report on inequalities ( ).
market inequalities among those in work. driving labour market (earnings) inequal -
This is because well paid, full-time jobs ity, preventing and tackling long-term As illustrated in Section 3.2, participation
remained relatively well protected, while unemployment and improving the effec - in training protects workers from unem-
lower-paid workers often ended up with tiveness and efficiency of social protec- ployment and increases the chances of
fewer hours worked and less take-home tion systems. the short-term unemployed going back
pay. In fact, in the years 2011-12 most to work. At the same time, investing in
of the new permanent jobs and full-time Mitigating rising labour market skills may help more people into employ -
jobs were high-paid jobs while the new inequalities ment but may increase dispersion in
low-paid jobs were increasingly part-time hourly wages. Great attention has to be
and temporary (see Chart 37). Likewise, Over the long term, the main drivers of paid to these interactions when design-
job losses tended to be concentrated in overall earnings inequalities are skills ing policy interventions.
low- to middle-income households, while bias, technological change and policy
richer households were relatively spared interventions that may affect employ- Tackling labour market segmentation,
and more often combine two full-time ment and earnings distribution differ- improving the quality of jobs (notably
jobs (see Chapter 1). ently, resulting in a complex impact on by ensuring access to adequate work-
ing hours and working conditions for all
Chart 36: Trends in market income inequalities between workers) and tackling underemployment
2005 and 2011, Gini coefficient, 18-65 population (e.g. involuntary part-time) can also miti -
gate earning inequalities and improve
0.08 0.6 the overall use of human capital. This
may require considering adaptations to
0.4 wage-setting mechanisms, increased
0.04 income security for the low waged and
0.2
the up- and re-skilling of the workforce
87
0 0 at all levels ( ).
-0.2 Measures to facilitate the entry of low-
-0.04 skilled workers into the labour market
2005-08 2008-11 2011 level (right axis) -0.4 may contribute to increasing the disper-
sion of hours worked and wages, while
-0.08 -0.6
LU PL SK SE BE CZ NL DE IT PT FI AT UK DK FR EE SI IE EL ES narrowing the total earnings dispersion
by reducing the number of individuals
Source: OECD, Income distribution database, own’s calculations. who are not working.
Note: No data for HU, HR, MT, CY, LT, LV ; no data for 2005 for SE, DE, IT; 2011 data not available
for BE (2010) and NL (2012).
Chart 37: Employment change by job-wage quintile and full-time or part-time status (a)
and temporary versus permanent (b), EU, 2011 Q2 to 2013 Q2
In thousands
1 000 1 000
Permanent
Temporary 500 Part-time
Full-time
500
0
5
0 -500
-1 000
-500
-1 500
-1 000 -2 000
Lowest Highest Lowest Highest
quintile quintile quintile quintile
Source: European Job Monitor 2014, based on Eurostat, EU-LFS and SES (Eurofound calculations)
Note: Data for 26 Member States; Germany and the Netherlands excluded due to data breaks.
86
( ) OECD (2013).
( ) See Chapter 1, ‘Shifts in the job structure
87
in Europe during the recession’ in
European Commission (2011a) and Box 3,
‘Employment polarisation in the crisis’ in
European Commission (2013d).
34