Page 37 - ePaper
P. 37
Job creation, productivity and more equality for sustained growth
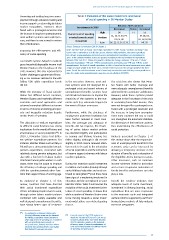
Preventing and tackling long-term unem - Table 3: Evolution of the social investment orientation
ployment through activation, training and of social spending in EU Member States
income support can also mitigate labour
market inequalities. However, when Investments in 2007 Between 2007 and 2011
faced with a prolonged recession and Decreased Stable Increased
the increase in long-term unemployment, Overall level of spending High DK FI SE
most welfare systems came under pres - oriented towards social Medium EL, ES, IT, HU, PT, AT, BE, DE,
sure, and there is now a need to restore investment RO, SI, UK FR, LU, LV, NL
their effectiveness. Low BG, CZ, IE, CY, LT, PL EE MT, SK
Source: European Commission (2014) Chapter 1.
Improving the effectiveness and effi- Notes: Member States in Group 1 have high expenditure in 2007, Group 2 medium and Group 3 low.
Levels refer to expenditure in child day care per relevant child population, education expenditure
ciency of social spending per relevant young population and mostly active unemployment expenditure per unemployed in
2007. In the columns Member States are grouped according to the real evolution of expenditure
Tax-benefit systems helped to maintain between 2007 and 2011. Stable real growth is defined for changes between 1.5 % and –1.5 % for
education expenditure, –4 % and +4 % for unemployment and family, and, –5 % and +5 % for active
gross household disposable income in all unemployment. The level of overall expenditure in 2007 is based on the social investment score, which
Member States in the first phase of the assigns an equal weight to the three areas. Overall trend is based on the average growth in the three
crisis. However, this also represented a areas. For NL the social investment score is based only on education and child day care expenditure as
data for mostly active unemployment measures are not reliable in ESSPROS.
further challenge to government financ-
ing as tax revenues declined in line with
falling GDP, while expenditure levels in the recession. However, most wel- The crisis has also shown that Mem-
did not. fare systems were not designed for a ber States with better coverage and
prolonged crisis and recent reforms of more adequate unemployment benefits
While the intensity of fiscal consoli- unemployment benefits systems have achieved better automatic stabilisation.
dation has differed across countries, not introduced measures to improve the However, while these systems proved
Member States used markedly different reactivity of the systems to the eco- adequate in the first phase of the crisis
economic and social approaches and nomic cycle (e.g. automatic triggers) in in sustaining household income, they
achieved somewhat different outcomes the event of future recessions. were not designed for a prolonged crisis.
in terms of income smoothing and pov- Faced with a prolonged recession and
erty and inequality reduction despite Furthermore, while the strictness of the increase in long-term unemploy-
similar levels of spending. employment protection legislation has ment most countries did not, or could
been further reduced in most coun- not, strengthen the automatic stabilisa-
The allocation of welfare expenditure tries, the coverage and adequacy of tion dimension of their welfare systems,
to different social functions has strong benefits did not improve, the financ - thus undermining the effectiveness of
implications for the overall efficiency and ing of active labour market policies social protection.
effectiveness of social protection ( ). In has declined slightly and participation
88
2010, EU Member States had differ- in training and lifelong learning has Analysis presented in Chapter 1 of
ent welfare expenditure patterns. For fallen slightly, although it did recover this review shows that the responsive-
instance, Member States such as Italy or slightly in 2013. Hence renewed atten- ness of unemployment benefits to the
Poland have a strong orientation towards tion needs to be paid to the orientation economic cycle can be increased by
pension expenditure, associated with of social expenditure and the interaction allowing a temporary increase in the
relatively strong pension adequacy, but of income support schemes with labour duration of benefits and a relaxation of
also with a low level of labour market market regulations. the eligibility criteria during recessions.
attachment among older workers. In such Other measures, such as minimum
cases, there may be scope to improve During the recession social investment income schemes linked to activation
the efficiency of old-age spending and in children and families (notably through and a more responsive indexation of
shift the spending towards other func- early childhood education and care) con - family benefits and pensions can also
89
tions that support those of working age. tinued to strengthen ( ), but there have play a role.
been signs of a weakening investment in
As analysed in Chapter 1 of this education and the unemployed in some Overall the evidence indicates that
review, countries that have directed Member States. Table 3 summarises the adequate levels of social investment,
their social investment expenditure evolution of the social investment orien - investment in lifelong learning, social
efforts to helping people return to work, tation of social spending. It shows that expenditure that are more responsive
through active labour market policies while a number of Member States seem to the economic cycle and integrated
combined with widely available and to be moving towards a social invest- welfare reforms supported by well-func -
well-designed unemployment benefits, ment model, others seem to be departing tioning labour markets all help mitigate
have shown better signs of resilience from it. excessive inequalities.
( ) As analysed in European Commission,
88
(2014e), efficiency gains can be obtained ( ) A recent report of the OECD analyses in
89
by shifting expenditure from functions in detail the ‘relative efficiency of cash versus
which high levels of spending are associated in-kind family benefits’. See OECD (October
with comparatively low economic or 2014). It provides insight on the potential
social outcomes, towards functions where efficiency gains of several combinations of
relatively low spending levels may explain cash and in-kind benefits for different levels
their below EU average outcomes. of spending and policy goals.
35