Page 33 - ePaper
P. 33
Job creation, productivity and more equality for sustained growth
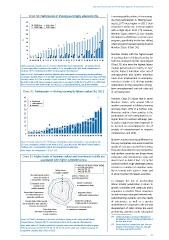
Chart 30: Participation in lifelong learning by education (%) Concerning public policies, it is encourag -
ing that participation in lifelong learn-
45 ing (LLL) ( ) was higher in 2013 than
78
40 2008 low 2013 low it had been before the recession (albeit
2008 high
2013 high
79
35 with a slight dip in 2011 ( )). However,
30 Member States where LLL was already
% 25 the highest in 2008 have seen the most
progress, specifically for the low-skilled,
20 where progress has been lacking in some
15 Member States (Chart 30).
10
5 Member States with the higher levels
0 of participation in lifelong learning for
BG RO HR HU EL SK LT PL IE LV BE CY *DE IT *LU EU-28 CZ ES EE MT PT SI *UK *NL *AT *FR *FI *SE *DK both the employed and the unemployed
Source: Eurostat, trng_lfse_03, 25-64 years old Member States indicated by * are among the top (Chart 31) also have the highest labour
25 most competitive countries in the world in 2013, according to the ‘IMD World Competitiveness market performance in terms of hav-
Yearbook 2013’, International Institute for Management Development. ing the highest transition rates out of
Note: ISCED-97 classification used: low education level corresponds to pre-primary, primary and lower unemployment and lowest transition
secondary education (levels 0-2) and high education level corresponds to first and second stage of tertiary
education (levels 5-6). Due to breaks in series, instead of 2008 values the 2009 value is used for LU and rates from employment to unemploy-
the 2010 value for NL. Due to breaks in series, there is no value for 2008 for CZ and PT, or for 2008 ‘high’ ment (see Section 3.1). This has positive
for LV. There is no ‘low’ shown for BG, RO, HR, SK, LT, CY and (2008 only) EE, due to low reliability. implications for the prevention of long-
term unemployment and exit rates out
Chart 31: Participation in lifelong learning by labour status (%), 2013 of unemployment.
45 However, Chart 31 shows that in seven
40 Employed Member States, only around 5 % of
Unemployed
35 Inactive workers participate in lifelong learning
30 and less than 10 % in a further nine.
25 Moreover, only in a few countries is the
20 participation of the unemployed in LLL
higher than for workers although pub-
15 lic policy might have been expected to
10 be focused on encouraging the use of
5 periods of unemployment to improve
0 competencies and skills.
BG RO HR EL HU SK PL IT IE LT LV *BE CY *DE MT PT ES CZ EU EE SI *AT *LU *UK *NL *FR *FI *SE *DK
Business surveys show big differences in
Source: Eurostat, trng_lfse_02, 25-64 years old, Member States indicated by * are among the top- the way companies and workers see the
25 most competitive countries in the world in 2013, according to the ‘IMD World Competitiveness
Yearbook 2013’, International Institute for Management Development. quality of managers and in-firm training.
Note: Values for unemployed: CY 5.5; FI 15.5. They also show that the most competitive
and resilient countries are those where
Chart 32: Higher levels of business values and investment in skills are companies and entrepreneurs value and
associated with higher competitiveness invest most in skills (Chart 32). In this
context, however, huge challenges clearly
Average EU-8 (Accession 2004)
EU best performers remain in a number of countries nota-
Skilled labour Average EU-15 bly in Central and Eastern Europe and
Average RO, BG
is readily available
The educational system 8 Labour relations are in some Southern European countries.
meets the needs of 7 generally productive
a competitive economy 6 5 To mitigate the risk of accelerating
Competent senior 4 Worker motivation labour market polarisation, a return to
managers are 3 in companies is high
readily available 2 1 growth combined with adequate policy
International experience 0 Apprenticeship is responses is needed. These responses
of senior managers is sufficiently implemented include stronger synergies between edu-
generally significant cation/training systems and the needs
Foreign high-skilled people Employee training is of enterprises, as well as a greater
are attracted to your country's a high priority in companies involvement of companies in the use and
business environment Attracting and retaining talents
Brain drain does is a priority in companies development of skills. Unless the worst
not hinder competitiveness performing countries make substantial
in your economy
78
( ) Lifelong learning is measured through the
Source: DG EMPL calculations on the basis of Business Survey results from the ‘IMD World participation rate in training and education in
Competitiveness Yearbook 2014’, International Institute for Management Development. the last four weeks.
79
Note: Index values (0-10 index points) for respective statements. Median values taken by group. ( ) Please note that comparisons over time are
EU best performers include SE, DE, DK, LU, NL, IE, UK and FI, which were ranked among top 20 hampered by breaks in series, for example
for France and the EU in 2013.
competitive countries (out of 61) in 2014.
31