Page 34 - ePaper
P. 34
Employment and Social Developments in Europe 2014
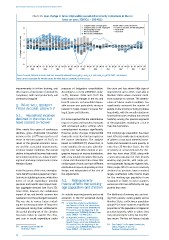
Chart 33: Real change in Gross Disposable Household Income by component in the EU
(year on year; 2005Q1 – 2014Q2)
Compensation of employees Net other current transfers
6 Compensation of self-employed Taxes on income, wealth (negative)
Net property income Real GDHI
Net social benefits Real GDP
4 2 Net social contributions
% change on previous year -2 0
-4
-6
Q1 Q2 Q3 Q4 Q1 Q2 Q3 Q4 Q1 Q2 Q3 Q4 Q1 Q2 Q3 Q4 Q1 Q2 Q3 Q4 Q1 Q2 Q3 Q4 Q1 Q2 Q3 Q4 Q1 Q2 Q3 Q4 Q1 Q2 Q3 Q4 Q1 Q2
2005 2006 2007 2008 2009 2010 2011 2012 2013 2014
Source: Eurostat, National Accounts, data non-seasonally adjusted [namq_gdp_k, nasq_nf_tr and namq_fcs_p] (DG EMPL calculations).
Note: GDHI EU aggregate for Member States for which data are available, GDP for EU-28.
improvements in in-firm training, and pressure of budgetary consolidation. the crisis and has shown little sign of
this requires a big change of attitude by According to a recent EUROMOD analy- improvement up to 2013, especially in
81
companies, skills and productivity will sis ( ), between 2008 and 2013 the Member States where economic condi-
continue to languish. total impact of changes in the tax and tions continue to worsen. The deterio-
5. Who will benefit benefit systems on household dispos- ration of labour market conditions has
able income was particularly strong in significantly increased the number of
from income growth? Ireland (-17 pps), Greece (-14 pps), Por- people on low income or living in jobless
tugal, Spain and Lithuania. households, with the overall reduction in
5.1. Household incomes household incomes resulting in increased
declined in the crisis but It is to be expected that the redistributive hardship among the poorest segments
have started to recover impact of taxes and transfers increases of the population, resulting in a rise in
with unchanged policy settings when material deprivation.
After nearly four years of continuous unemployment increases significantly.
declines, gross disposable household However, policy changes implemented The working-age population has been
80
income in the EU ( ) increased in real during the crisis also had an impact on most affected, mainly due to rising levels
terms in the last quarter of 2013, as the income distribution. The analysis of jobless or low work-intensity house-
82
result of the general economic recov- based on EUROMOD ( ) shows that, in holds and increased in-work poverty. In
ery and the associated improvements many countries, the measures taken dur- more than 20 Member States, the risk
in labour market conditions. The overall ing the crisis had either neutral or pro- of poverty or social exclusion for chil-
decline in household incomes had mainly gressive impacts on income distribution, dren has risen since 2008, along with
been driven by job losses, reduced work - with a few notable exceptions (Germany, a worsening situation for their (mostly
ing hours and wage compression in some Estonia and Lithuania). It also shows that working-age) parents, with single-par-
Member States. similar types of tools can have different ent households facing the highest risks.
distributional impacts depending on their Older people (65+) have been relatively
In the first years of the crisis, unemploy - design, and independent of the size of sheltered as pensions have remained
ment benefit systems played an impor- the adjustments. largely unaffected, while income levels
tant role in stabilising income, while other for the working-age population have
items of social expenditure (notably 5.2. Rising poverty stagnated or fallen. In most countries,
pensions and health) also helped main- mainly affects the working- women are still more affected by old-age
tain aggregate demand (see Chart 33). age population and children poverty than men.
Since 2011, however, the stabilisation
impact of tax and benefit systems has As could be expected, poverty and social The likelihood of entering into and exit-
weakened over the prolonged recession. exclusion in the EU worsened during ing from poverty varies greatly across
This was due to various factors includ- ( ) De Agostini P., Paulus A., Sutherland H. Member States and between population
81
ing the increasing number of long-term and Tasseva I. (2014), ‘The effect of tax- groups ( ). In some countries a significant
83
unemployed losing their entitlements, benefit changes on income distribution in proportion of the population is trapped in
EU countries since the beginning of the
the partial phasing-out of the stimulus economic crisis’, EUROMOD Working Paper persistent poverty, while in others they
measures taken to counter the crisis, Series EM9/14 – 02 May 2014. may exit poverty for a time but neverthe -
82
and cuts in social expenditure under ( ) De Agostini P., Paulus A., Sutherland H. less return. The key risk factors include
and Tasseva I. (2014), ‘The effect of tax-
benefit changes on income distribution in
83
EU countries since the beginning of the ( ) See Chapter 2 in European Commission,
( ) Estimate based on data for economic crisis’, EUROMOD Working Paper 2013c, Chapters 3 and 4 in
80
20 Member States. Series EM9/14 – 02 May 2014. European Commission, 2011a.
32