Page 38 - ePaper
P. 38
Employment and Social Developments in Europe 2014
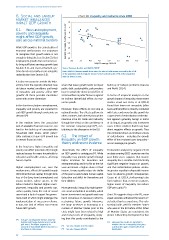
6. Social and labour Chart 38: Inequality and resilience since 2008
market imbalances
impact GDP growth
6.1. How unemployment, 5 SE AT DE
poverty and inequality 0 FR
might affect GDP growth, -5 DK NL BE UK
also across national borders Real GDP per capita, % difference 2013-07 10 FI ES PT
-10
While GDP growth is the central pillar of -15 LU IE IT
economic performance, it is important
to recognise that growth alone is not -20
enough to bring jobs (see Section 2), that -25 EL
employment growth does not necessar- 3.0 3.5 4.0 4.5 5.0 5.5 6.0 6.5 7.0
ily bring sufficient earnings growth (see S80/S20 average 2005-07
Section 5.1), and that tax-benefit sys- Source: Eurostat, ilc_di11 and AMECO, HVGTP.
tems do not necessarily ensure adequate Note: S80/S20: (Income quintile share ratio: the ratio of total income received by the 20 %
redistribution (see Section 5.3). of the population with the highest income to that received by the 20 % of the population
with the lowest income.
It is also necessary to consider the inter -
actions from the opposite direction: how Given that lower growth tends to impair build-up of today’s problems (Darvas
do labour market conditions and levels public debt sustainability, policymakers and Wolff, 2014).
of inequality and poverty affect GDP have to weigh the direct (cost) effect of
growth? All three possible causalities social welfare on public finances against In terms of empirical analysis on the
come with a time dimension: its indirect (beneficial) effect via eco- growth impact of inequality, three recent
nomic growth. studies stand out. Ostry et al. (2014)
In the short term, higher unemployment, found that lower net inequality (after
inequality and poverty are expected to Moreover, these effects do not stop at taxes and benefits) is robustly correlated
curb GDP growth through constraints on national borders. The effects spill over to with faster and more durable growth for
demand ( ). other countries, both directly through the a given level of redistribution. Redistribu -
90
intensive intra-EU trade and indirectly tion appears generally benign in terms
In the medium term, the associated through the effect on the confidence in of its impact on growth; only in extreme
lack of available financial resources can the common European project ( ), con- cases is there evidence that it may have
91
lead to the build-up of unsustainable tributing to the divergence in the EU. direct negative effects on growth. Thus
household debt levels, which poten the combined direct and indirect effects
-
tially endangers future GDP growth (via 6.2. The impact of of redistribution – including the growth
increased financial risks). inequality on GDP growth: effect of the resultant lower inequality –
theory and recent evidence are on average pro-growth.
In the long term, higher inequality and
poverty can affect potential GDP, through Theoretically the effect of inequality Econometric analysis by Cingano (2014)
reduced access for many households to on GDP growth is ambiguous ( ). While on data covering OECD countries over the
92
education and health services, affecting inequality may promote growth through past thirty years suggests that income
human capital. higher incentives for innovation and inequality has a sizeable and statistically
entrepreneurship, and in so far as the rich significant negative impact on growth,
Higher unemployment can, over the save and invest a higher share of their and that redistributive policies achiev-
medium term, affect GDP growth through income, it may equally reduce the ability ing greater equality in disposable income
diminished human capital, through skills of the poor to accumulate human capital have no adverse growth consequences.
loss of the (long-term) unemployed and (education and skills) for themselves and Causa et al. (2014, forthcoming) also
young workers, whose access to the their children. find evidence that, in OECD countries,
labour market is blocked. Higher unem- higher levels of inequality can reduce
ployment, inequality and poverty can, More generally, inequality might gener- GDP per capita ( ).
93
rather quickly, bring the risk of social ate social and political instability, which
unrest and a lack of support for govern- harms investment and growth and may Chart 38 suggests that, in the EU, more
ment, both of which might endanger the harm consensus on necessary reforms, equal societies withstood the recent cri-
implementation of necessary reforms. restraining future growth. Moreover, sis better than less equal ones. This rela -
In turn, this lack of reform can restrain the large increases in borrowing in a tionship holds well for Member States
future GDP growth. number of Member States prior to the who were in the EU before 2004. When
crisis might have been related to high all Member States are considered, the
and rising levels of inequality, imply- picture is blurred by developments in four
ing that this partly contributed to the
( ) This goes via disposable income, domestic
90
93
demand and foreign demand (cross-border ( ) Moreover, the results are invariant to
spill-overs). The higher propensity to 91 whether the rise in inequality takes place
consume of households with low income is a ( ) See also Chapter 4 of this review. mainly in the upper or lower half of the
92
vital factor in this process. ( ) See also Cingano (2014). distribution.
36