Page 191 - ePaper
P. 191
Chapter 3: The future of work in Europe: job quality and work organisation for a smart, sustainable and inclusive growth
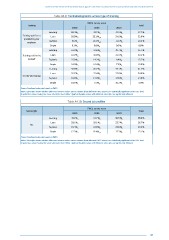
Table A4.9: Trend developments across type of training
EWCS survey wave
Training Total
2000 2005 2010
Learning 50.4 % a 49.7 % a 44.2 % b 47.7 %
Training paid for or Lean 32.9 %
provided by your 30.9 % a 33.1 % a, b 34.6 % b
employer Taylorist 9.6 % a 10.3 % a, b 11.6 % b 10.6 %
Simple 9.1 % a 6.8 % b 9.6 % a 8.8 %
Learning 33.0 % a 44.6 % b 49.7 % b 45.7 %
Training paid for by Lean 18.0 % a 30.8 % b 32.9 % b 30.2 %
yourself Taylorist 25.0 % a 14.2 % b 9.4 % b 13.2 %
Simple 24.0 % a 10.4 % b 7.9 % b 10.9 %
Learning 38.8 % a 45.2 % b 39.1 % a 41.3 %
Lean 26.7 % a 32.4 % b 35.8 % c 34.0 %
On-the-job training
Taylorist 16.0 % a 14.9 % a 14.8 % a 14.9 %
Simple 18.5 % a 7.5 % b 10.3 % c 9.8 %
Source: Eurofound estimates based on EWCS.
Notes: Subscripts denote whether difference between values across columns (from different EWCS waves) are statistically significant at the 0.05 level.
In particular, values having the same subscripts do not differ significantly while values with different subscripts are significantly different.
Table A4.10: Second job profiles
EWCS survey wave
Second job Total
2000 2005 2010
Learning 43.2 % a 33.7 % b 36.5 % b 38.0 %
Lean 26.7 %
Yes 29.1 % a 28.1 % a 23.7 % a
Taylorist 15.4 % a 22.8 % b 22.6 % b 20.2 %
Simple 12.3 % a 15.4 % a, b 17.3 % b 15.1 %
Source: Eurofound estimates based on EWCS.
Notes: Subscripts denote whether difference between values across columns (from different EWCS waves) are statistically significant at the 0.05 level.
In particular, values having the same subscripts do not differ significantly while values with different subscripts are significantly different
189